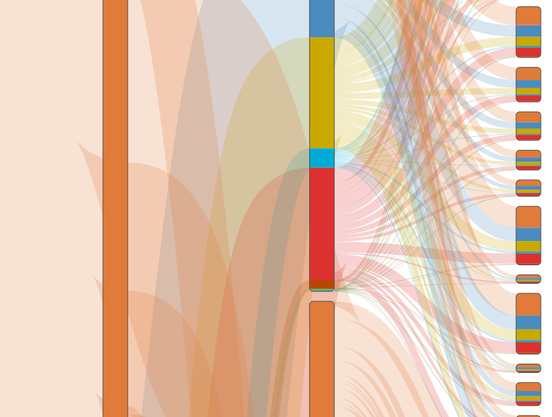
Every time I am like "welp, software engineers had a good run" a coding agent produces mind-bending (but in this case, somewhat beautiful) slop, garbage, or chartjunk like this.
Every time I am like "welp, software engineers had a good run" a coding agent produces mind-bending (but in this case, somewhat beautiful) slop, garbage, or chartjunk like this.
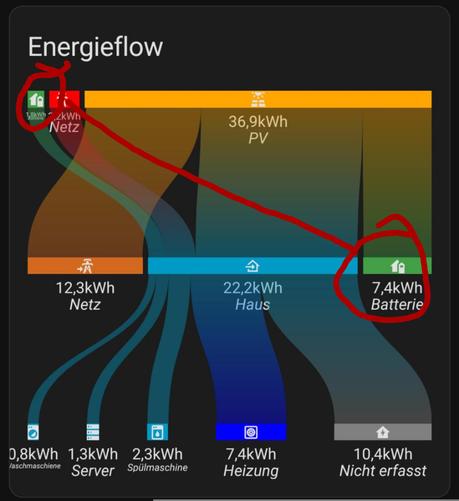
[Sankey] Energy flow in Germany (svg, BdEW 2023)
https://piefed.social/c/dataisbeautiful/p/1981721/sankey-energy-flow-in-germany-svg-bdew-2023
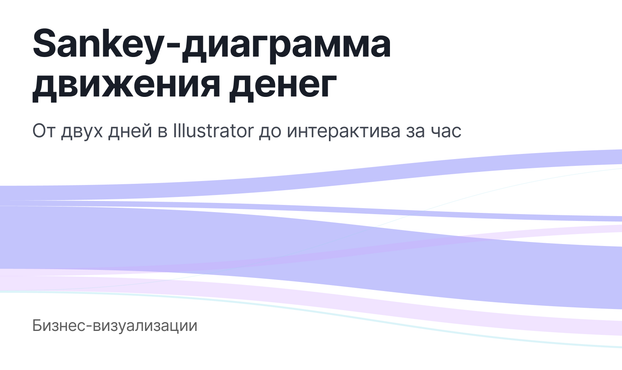
Sankey‑диаграмма движения денег: от двух дней в Illustrator до интерактива за час
Как понять, куда на самом деле уходят деньги, если смотреть на них как на поток, а не как на набор категорий. На реальном примере показываю, как из банковской выписки собрать Sankey-диаграмму, где помогает AI, где ошибается и какие решения приходится принимать. В итоге получается не статичная картинка, а интерактивная модель, с которой можно работать: разбирать структуру расходов, видеть взаимосвязи и находить узкие места. Подход применим не только к личным финансам, но и к бизнесу — для анализа движения денег, затрат и сложных процессов. Будет полезно дизайнерам, аналитикам и всем, кто работает со сложными системами
https://habr.com/ru/articles/1016620/
#Sankey #визуализация_данных #финансы #анализ_данных #UX_дизайн #интерфейсы #бизнесаналитика #D3js #React #AI
🛠️ Đã tạo công cụ nội bộ dùng Sankey để hiển thị timeline các ticket, giúp bộ phận không kỹ thuật nắm rõ tiến độ trong stand‑up sáng. 2 tuần thử nghiệm, giảm bớt câu hỏi và cải thiện giao tiếp giữa sales & dev. Mọi người có thể thử, đưa phản hồi nhé! #SaaS #Productivity #TechTool #CôngCụ #Sankey #QuảnLýDựÁn #NonTech
https://www.reddit.com/r/SaaS/comments/1qmdzej/shared_experience_morning_standups_make_no_sense/

Somebody please fix those equal-width Sankey flows with percentages
How do I get my life partner to understand #Sankey diagrams