Home
Explore
mastodon.social
infosec.exchange
mstdn.social
mstdn.jp
hachyderm.io
piaille.fr
social.vivaldi.net
mastodon.world
troet.cafe
mastodon.uno
mastodon.gamedev.place
techhub.social
social.tchncs.de
mastodon.nl
norden.social
flipboard.social
mastoturk.org
kolektiva.social
occm.cc
mathstodon.xyz
nrw.social
tech.lgbt
mastodonapp.uk
defcon.social
universeodon.com
c.im
masto.es
sueden.social
mstdn.ca
toot.community
tkz.one
sfba.social
mastodon.scot
det.social
mstdn.party
mastodon.ie
hessen.social
ohai.social
ruhr.social
mastodontech.de
pouet.chapril.org
livellosegreto.it
mastodon.nu
mastodon.bida.im
ieji.de
indieweb.social
social.linux.pizza
mastodon.eus
social.cologne
mastodon.au
muenchen.social
ioc.exchange
social.anoxinon.de
mastodon.green
mastodont.cat
fediscience.org
ruby.social
nerdculture.de
metalhead.club
uri.life
cyberplace.social
mindly.social
mastodon.de
masto.nu
mastodon.ml
m.otter.homes
dresden.network
phpc.social
sunny.garden
mastodontti.fi
toot.wales
climatejustice.social
noc.social
fairy.id
furry.engineer
sciences.social
bark.lgbt
mastodon.me.uk
glasgow.social
mastodon.com.pl
mstdn.plus
blorbo.social
bonn.social
freiburg.social
mastorol.es
rollenspiel.social
tooting.ch
rheinneckar.social
c7.io
mementomori.social
rivals.space
hcommons.social
mastodon.gal
mstdn.games
discuss.systems
lgbtqia.space
mast.lat
social.sciences.re
masto.pt
expressional.social
wehavecookies.social
mapstodon.space
mastodon-belgium.be
wien.rocks
snabelen.no
ursal.zone
cupoftea.social
privacysafe.social
gaygeek.social
tilde.zone
sakurajima.moe
retro.pizza
darmstadt.social
woof.tech
en.osm.town
ludosphere.fr
mastodon.berlin
mast.dragon-fly.club
peoplemaking.games
graz.social
muenster.im
kanoa.de
musician.social
pawb.fun
qdon.space
oslo.town
bookstodon.com
famichiki.jp
veganism.social
mastodon.uy
socel.net
union.place
witter.cz
urusai.social
h4.io
toad.social
mstdn.business
mstdn.dk
xarxa.cloud
theblower.au
eupolicy.social
mustard.blog
tooot.im
machteburch.social
musicworld.social
4bear.com
fandom.ink
tea.codes
burningboard.net
opalstack.social
thecanadian.social
spore.social
toot.kif.rocks
masto.nyc
pnw.zone
mastodon.london
mastodon.la
mountains.social
hear-me.social
disabled.social
libretooth.gr
poliversity.it
graphics.social
dizl.de
archaeo.social
bahn.social
ciberlandia.pt
furries.club
dmv.community
fedi.at
library.love
mastodon.pnpde.social
gardenstate.social
cultur.social
vkl.world
utopia.cool
babka.social
mast.hpc.social
mastodon.energy
tuiter.rocks
frikiverse.zone
is.nota.live
mendeddrum.org
fulda.social
burma.social
gamepad.club
donphan.social
social.roadfm.fr
muri.network
toot.si
puntarella.party
social.politicaconciencia.org
mastodon.africa
bzh.social
tchafia.be
masto.nobigtech.es
tyrol.social
wargamers.social
norcal.social
lou.lt
hispagatos.space
w3c.social
social.silicon.moe
mograph.social
lsbt.me
ani.work
datasci.social
epsilon.social
gayfr.social
khiar.net
mastodon.pirateparty.be
qaf.men
opencoaster.net
toot.funami.tech
hometech.social
socialbc.ca
masto.yttrx.com
friendsofdesoto.social
esq.social
theatl.social
toot.garden
indieauthors.social
lewacki.space
leipzig.town
mastodon.vlaanderen
epicure.social
mstdn.animexx.de
kurry.social
genealysis.social
toot.re
arvr.social
est.social
toki.social
pointless.chat
karlsruhe-social.de
frankfurt.social
elekk.xyz
hoosier.social
mastodon.tn
umbracocommunity.social
apobangpo.space
devianze.city
seocommunity.social
mastodon.cr
paktodon.asia
fribygda.no
colorid.es
retro-gaiden.com
mastodon.education
toots.nu
mastodon.wien
twoot.site
techtoots.com
katholisch.social
poweredbygay.social
frontrange.co
ruhrpott.social
gamerstavern.online
klog.tw
mastodon.sg
nwb.social
h-net.social
jazztodon.com
okla.social
rheinhessen.social
raphus.social
mastodon.pub.solar
rail.chat
mastodon.cl
mastodon.bot
mastodon-swiss.org
turtleisland.social
blackqueer.life
bologna.one
stereodon.social
fairmove.net
elizur.me
birdon.social
mastodon.cipherbliss.com
camp.smolnet.org
cwb.social
fpv.social
mastodon.free-solutions.org
k8s.social
mikumikudance.cloud
woodworking.group
mastodon.babb.no
biplus.social
planetearth.social
growers.social
mastodon.iow.social
squawk.mytransponder.com
mastodon.frl
social.diva.exchange
episcodon.net
skastodon.com
ailbhean.co-shaoghal.net
lounge.town
mastodon.hosnet.fr
cville.online
mastodon.bachgau.social
kzoo.to
kcmo.social
mcr.wtf
23.illuminati.org
syzito.xyz
connectop.us
mastodon.bahia.no
mastodon.ee
social.ferrocarril.net
synapse.cafe
creators.social
silversword.online
nfld.me
burnout.cafe
social.avali.zone
polsci.social
dariox.club
mastodon.ph
mastodon.mg
fpl.social
social.main-angler.de
bath.social
ms.maritime.social
darticulate.com
psu.social
newforest.social
bvb.social
netsphere.one
troet.fediverse.at
nutmeg.social
mastodon.re
social.sndevs.com
kjas.no
earth.law
ceilidh.online
douzepoints.social
saint-paul.us
devhub.social
learningdisability.social
wxw.moe
mastodon.sdf.org
shelter.moe
exquisite.social
drupal.community
Log In
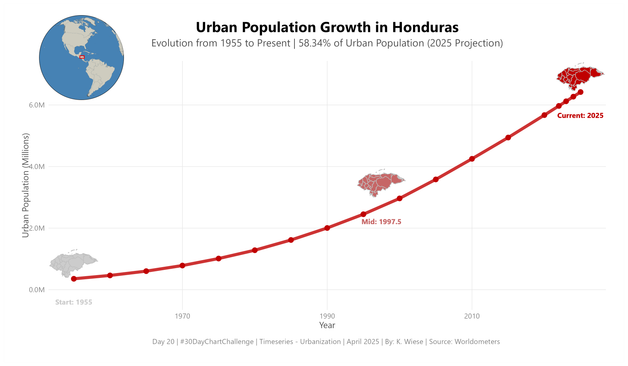
Hondunauta
Apr 20, 2025
Day 20 | Timeseries – Urbanization |
#30DayChartChallenge
. Visualization made with R using
#ggplot2
,
#sf
,
#dplyr
,
#scales
,
#grid
,
#ggshadow
,
#extrafont
and
#cowplot
. | Source: Worldometers
0
0
0
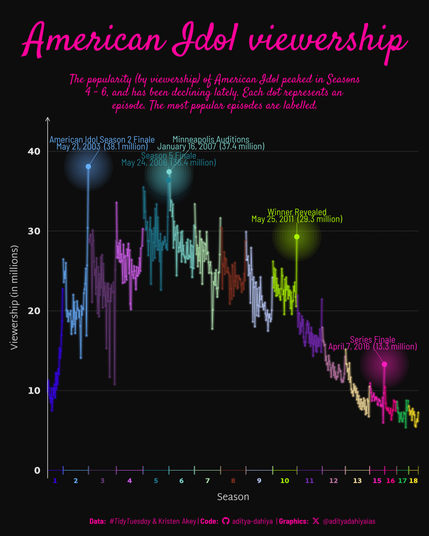
Aditya Dahiya
Jul 26, 2024
#TidyTuesday
Viewership of
#AmericanIdol
episodes peaked in Seasons 4-6, and has been declining lately. The
#Finale
are the most popular episodes.
Data:
@kkakey
Code🔗
https://
tinyurl.com/tidy-am-idol
Tools
#rstats
#ggplot2
#ggshadow
by @
[email protected]
& Mac Menem
Presentations, Projects & Data Viz - American Idol Episodes’ Viewership
0
0
1