‪Chuck Purvis‬ ‪@charleypurvis.bsky.social‬
·
4m
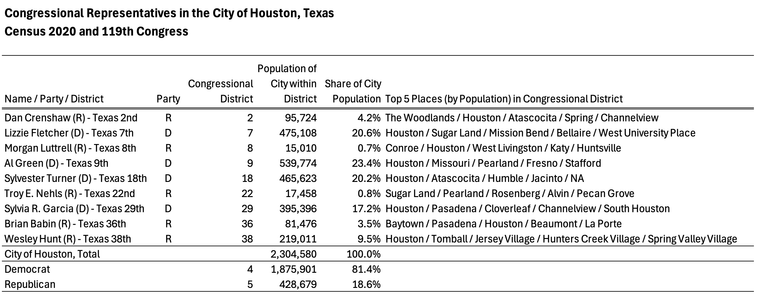
‪Houston, Texas has 9 US Congressional Districts, 5 districts where Houston is the largest city.

4 of the 9 districts are held by Democrats; the other 5 by Republicans.

#Houston 2020 pop. was 2,304,580.

My own analysis using #rstats #Census2020 and data from clerk.house.gov for #119thCongress

The City of Chicago has 9 US Congressional Districts, with 8 districts where Chicago is the largest city.

All 10 Chicago Congressional Districts are held by Democrats.

My own analysis using #rstats #Census2020 and data from clerk.house.gov for #119thCongress

#Chicago #Illinois

Los Angeles City has 10 US Congressional Districts, 7 where the largest city is LA.

All 10 Los Angeles Congressional Districts are held by Democrats.

My own analysis using #rstats #Census2020 and data from clerk.house.gov for #119thCongress

#LosAngeles #California

New York City has 13 US Congressional Districts, 11 entirely within the five boroughs of NYC, two straddling into neighbor counties.

12 of the 13 NYC Congressional Districts are held by Democrats.

My own analysis using #rstats #Census2020 and data from clerk.house.gov for #119thCongress

Easy to create age-sex population pyramids using #census2020 demographic profile data released May 2023; and the #rstats programs #tidycensus #tidyverse and #ggplot2

Adapted from the Kyle Walker book “Analyzing US Census Data”

scripts are shared:
https://github.com/chuckpurvis/r_scripts

#census

GitHub - chuckpurvis/r_scripts: R scripts and related input and output data

R scripts and related input and output data. Contribute to chuckpurvis/r_scripts development by creating an account on GitHub.

GitHub
We are still digging into the #Census2020 Demographic Profile and Demographic and Housing Characteristics products. Check out this brief with key insights including an interactive population pyramid, select data files and much more - https://t.co/QFCK9LVQ8t https://census2020-pasdc.opendata.arcgis.com/apps/eac843ed68944f0da49bd6c6ca19e3a8/explore?utm_source=censusSDC
PA State Data Center on Twitter

“We are still digging into the #Census2020 Demographic Profile and Demographic and Housing Characteristics products. Check out this brief with key insights including an interactive population pyramid, select data files and much more - https://t.co/FibBkMOxWB”

Twitter
While big cities across the country are having mixed results in challenging the #Census2020 counts, our Population Estimates Program, along with the City of Boston, assisted the Secretary of the Commonwealth in a successful challenge. https://t.co/BqjUEGscXH: While big cities across the country are having mixed results in challenging the #Census2020 counts, our Population Estimates Program, along with the City of Boston, assisted the Secretary of the Commonwealth in a… http://ow.ly/F81J50Oo006?utm_source=censusSDC
UMDonahueInstitute on Twitter

“While big cities across the country are having mixed results in challenging the #Census2020 counts, our Population Estimates Program, along with the City of Boston, assisted the Secretary of the Commonwealth in a successful challenge. https://t.co/ADcO5fp6sM”

Twitter
via @UMassAmherst: Boston wins back student populations and others in #Census2020 challenge:
@UMassDonahue Institute a key player in technical support to the Secretary of the Commonwealth https://www.umass.edu/news/article/boston-wins-back-student-populations-and-others-us-census-2020-challenge?utm_source=censusSDC
Boston Wins Back Student Populations and Others in U.S. Census 2020 Challenge | UMass Amherst

The UMass Donahue Institute was a key player in technical support to the Secretary of the Commonwealth in his challenge of the undercount of students living in college and university housing in the City of Boston during the 2020 Census.

UMass Amherst

Today I learned a new #rstats package: #cartogram . This allows creation of Dorling cartograms (non-overlapping bubbles).

It's using the same 2020 presidential election county-level databased I created merging MIT Election Lab data with #tidycensus -derived files from the #census2020

The California Dorling plot is better by showing non-overlapping circles, especially in the Bay Area.

The Texas Dorling plot shows Harris County (Houston) nudged into the Gulf of Mexico. Dallas County and Travis County (Austin) have pushed (repelled) the little red bubbles to be more prominent.

All maps were created with the #tidyverse package #ggplot2

This is a lot of fun, for me, at least!

I thought that for some reason Ceridigion was the queer centre of wales.

https://www.ons.gov.uk/census/maps/choropleth/identity/sexual-orientation/sexual-orientation-4a/not-answered?lad=W06000008

but it turns out they are all just to shy to answer...

(Big give away peeps! )

#census2020

Sexual orientation - Census Maps, ONS

Census maps is an interactive tool to explore Census 2021 data across England and Wales for different topics down to a neighbourhood level.