“It’s the bell curve again”*…
Joseph Howlett on how the central limit theorem, which started as a bar trick for 18th-century gamblers, became something on which scientists rely every day…
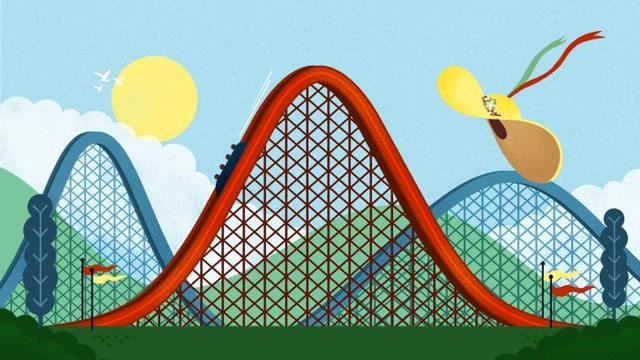
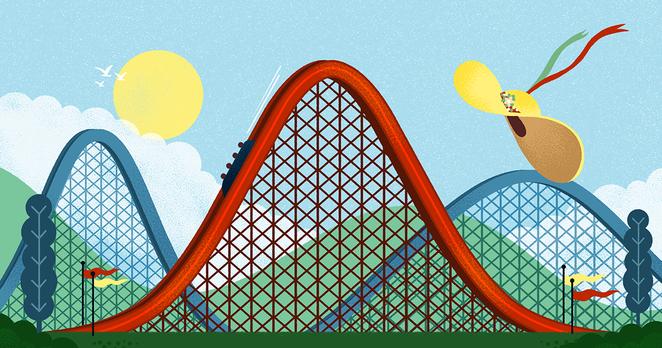
No matter where you look, a bell curve is close by.
Place a measuring cup in your backyard every time it rains and note the height of the water when it stops: Your data will conform to a bell curve. Record 100 people’s guesses at the number of jelly beans in a jar, and they’ll follow a bell curve. Measure enough women’s heights, men’s weights, SAT scores, marathon times — you’ll always get the same smooth, rounded hump that tapers at the edges.
Why does the bell curve pop up in so many datasets?
The answer boils down to the central limit theorem, a mathematical truth so powerful that it often strikes newcomers as impossible, like a magic trick of nature. “The central limit theorem is pretty amazing because it is so unintuitive and surprising,” said Daniela Witten, a biostatistician at the University of Washington. Through it, the most random, unimaginable chaos can lead to striking predictability.
It’s now a pillar on which much of modern empirical science rests. Almost every time a scientist uses measurements to infer something about the world, the central limit theorem is buried somewhere in the methods. Without it, it would be hard for science to say anything, with any confidence, about anything.
“I don’t think the field of statistics would exist without the central limit theorem,” said Larry Wasserman, a statistician at Carnegie Mellon University. “It’s everything.”
Perhaps it shouldn’t come as a surprise that the push to find regularity in randomness came from the study of gambling…
Read on for the fascinating story of: “The Math That Explains Why Bell Curves Are Everywhere,” from @quantamagazine.bsky.social.
Howlett concludes by observing that “The central limit theorem is a pillar of modern science, ultimately, because it’s a pillar of the world around us. When we combine lots of independent measurements, we get clusters. And if we’re clever enough, we can use those clusters to find out something interesting about the processes that made them”– which follows from the story he shares.
Still, we’d do well to remember that there are limits to its applicability, both descriptively (as Nassim Nicholas Taleb points out, “because the bell curve ignores large deviations, cannot handle them, yet makes us confident that we have tamed uncertainty”) and prescriptively (as Benjamim Bloom argues, “The bell-shaped curve is not sacred. It describes the outcome of a random process. Since education is a purposeful activity….the achievement distribution should be very different from the normal curve if our instruction is effective).
For (much) more, see Peter Bernstein‘s wonderful Against the Gods: The Remarkable Story of Risk
* Robert A. Heinlein, Time Enough for Love
###
As we noodle on the normal distribution, we might send curve-shattering birthday greetings to Norman Borlaug; he was born on ths date in 1914. An agronomist, he developed and led initiatives worldwide that contributed to the voluminous increases in agricultural production we call “the Green Revolution.” Borlaug was awarded multiple honors for his work, including the Nobel Peace Prize, the Presidential Medal of Freedom, and the Congressional Gold Medal; he’s one of only seven people to have received all three of those awards.
source
#agriculture #BellCurve #centralLimitTheorem #culture #GreenRevolution #history #Mathematics #normalDistribution #NormanBorlaug #Science #statistics