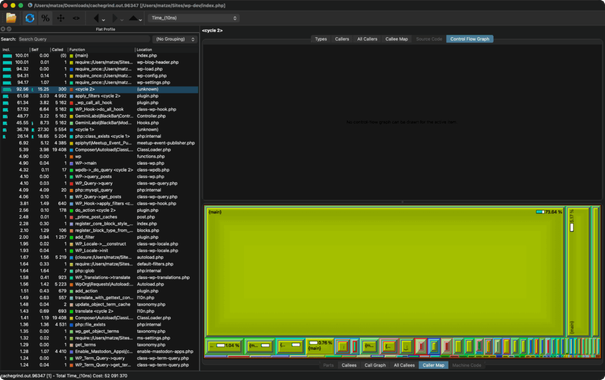
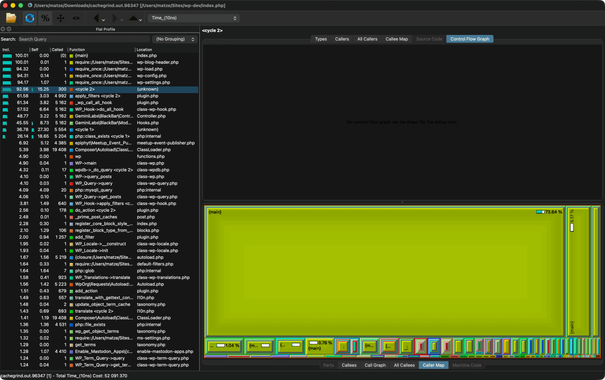
Wenn es um Performance-Debugging geht, gibt es eine Menge verfügbarer Werkzeuge. In den letzten Jahren habe ich nach einem gesucht, das wirklich leicht verwendbar ist und Engpässe selbst gut erkennt.

Es gibt einige, die spezifisch für WordPress sind, beispielsweise als Plugins, und einige für generelles Performance-Debugging in PHP. Andere wiederum benötigen eine bestimmte PHP-Erweiterung. Im folgenden Artikel decke ich alle möglichen Typen ab.

[…]

https://epiph.yt/blog/2026/php-debugging-werkzeuge-fuer-wordpress/ #CodeProfiler #Debugging #Performance #QueryMonitor #Sentry #Tideways #WordPress #Xdebug #XHProf

When it comes to performance debugging, there are a wide variety of tools available. The last years, I searched for one that is actually easily usable and provides easy access in identifying bottlenecks.

There are some that are specific to WordPress, e.g. as plugins, some allow general performance debugging via PHP and some require a PHP extension to be loaded. I’ll cover all of these types in the following article.

[…]

https://epiph.yt/en/blog/2026/php-performance-debugging-tools-for-wordpress/ #CodeProfiler #Debugging #Performance #QueryMonitor #Sentry #Tideways #WordPress #Xdebug #XHProf
PHP performance debugging tools for WordPress | Epiphyt

When it comes to performance debugging, there are a wide variety of tools available. I searched for one that is actually usable in identifying bottlenecks.

Epiphyt

Over the weekend I vibe-coded a fix for the #xhprof PHP profiler extension which was SEGFAULTING due to a memory issue on shutdown.

You can now safely exclude function names from profiling! I hope this gets merged and released with the PHP 8.4 support fixes that have landed already.

Профилирование PHP (Laravel) приложений с xhprof. Учимся искать ботлнеки

Привет, PHP-шники! Вам знакомо то чувство, когда ваш PHP-код отрабатывает за дофига миллисекунд, а иногда и секунд, и вы не можете понять, в чём дело и где тот говнокод, который я (или не я, а мой коллега 😵‍💫) когда-то написал? В этой статье хочу немного рассказать на примере профайлинга PHP-кода, как перестать гадать и начать выявлять боттлнеки, которые всё тормозят. Короче, помочь поискать говнокод.

https://habr.com/ru/articles/823156/

#laravel #php #roadrunner #buggregator #xhprof #profiling #profiler

Профилирование PHP (Laravel) приложений с xhprof. Учимся искать ботлнеки

Привет, PHP-шники! Вам знакомо то чувство, когда ваш PHP-код отрабатывает за дофига миллисекунд, а иногда и секунд, и вы не можете понять, в чём дело и где тот говнокод, который я (или не я, а мой...

Хабр
What happens during a #TYPO3 #v13 frontend call? #DDEV integrates the #PHP #Profiler #XHProf which visualizes the process as a #svg #callgraph. This will be useful for research in our #Translation Handling #Initiative. Are you able to follow the path? 🕸️😄 https://www.youtube.com/watch?v=HMInYFu1LqU
TYPO3 13.0.0-dev Callgraph by XHProf

YouTube
Profiling Drupal AJAX requests

One of my favorite development tasks is performance engineering. I love taking an application and analyzing it to increase performance. Application performance monitoring (APM) tools like New Relic and Blackfire.io are tools every developer should have in their toolkit. New Relic is for passive performance monitoring of your application in production. Blackfire is for active performance monitoring and profiling in any environment.

mglaman.dev
Nice tutorial ! RT @[email protected]: L'art de documenter les petites galère de la vie #xhprof #ubuntu #libtool #blog http://xav.cc/xhprof