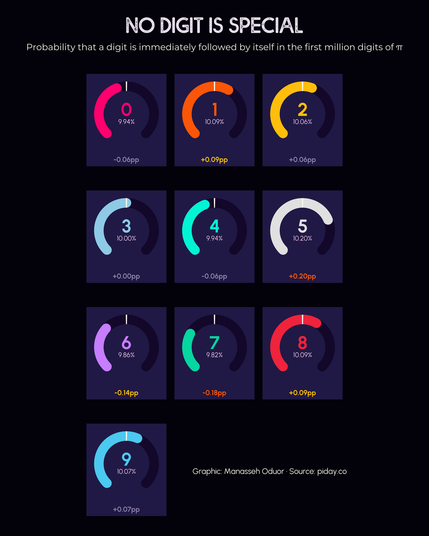
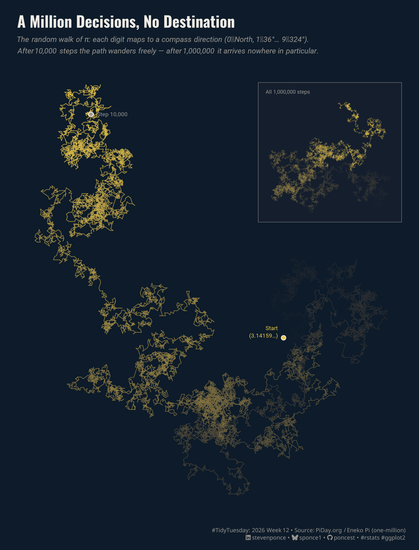
Another #PiDay themed visualisation for #TidyTuesday this week!

๐Ÿ“Š Made with #ggplot2
๐Ÿ› ๏ธ Function to shown first n digits and highlight specific ones
๐Ÿช„ Gif created with {magick}

Code: https://github.com/nrennie/tidytuesday/tree/main/2026/2026-03-24

#DataViz #RStats

This week's #TidyTuesday data is about salmon mortality ๐ŸŸ in Norway

๐Ÿ“Š Small multiple line charts show each region
๐Ÿ” Larger chart explains how to read
๐Ÿงฉ Arranged using {ggh4x} with {cowplot} for annotations

Code: https://github.com/nrennie/tidytuesday/tree/main/2026/2026-03-17

#RStats #DataViz #ggplot2

Last weekโ€™s #TidyTuesday: how different age groups valued probability phrasesโ€”with differences most apparent between the two ends, under 18 and 75+.

Also, how is โ€œwill happenโ€ not 100% forโ€ฆ100% of people?

https://tidytuesday.seanlunsford.com/2026/week-10/

Finally got around to digging into the Netflix #tidytuesday viewing data. Just ~100 shows capture ~25% of all views! Very cool dataset. https://ahoulette.com/posts/netflix-analysis/ #rstats #dataviz
Netflix Viewing Analysis: A Look Into the Catalog Abyss โ€“ Semi-Random Data Musings

A really fun dataset for this week's #TidyTuesday, looking at how people interpret different probabilistic statements ๐Ÿ“Š

There's so many aspects of this to visualise, but I decided make some barcode plots comparing how people from the UK and US responded. It seems we're much the same with the exception of may/might happen and highly likely - where our American friends are more optimistic!

Code: https://github.com/nrennie/tidytuesday/tree/main/2026/2026-03-10

#DataViz #RStats #ggplot2