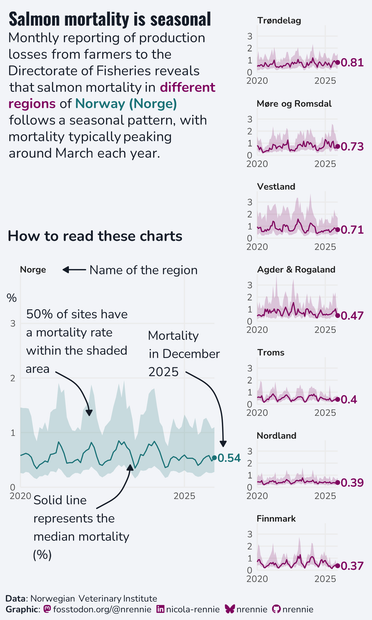
This week's #TidyTuesday data is about salmon mortality 🐟 in Norway
📊 Small multiple line charts show each region
🔍 Larger chart explains how to read
🧩 Arranged using {ggh4x} with {cowplot} for annotations
Code: https://github.com/nrennie/tidytuesday/tree/main/2026/2026-03-17