've been working on my Arkansas food security dashboard in Tableau Public, and I wanted to show off some striking data.
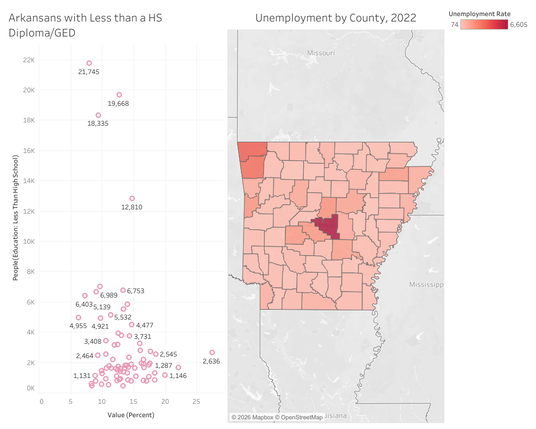
a.) A correlation between not having a HS Diploma/GED and unemployment data per county.
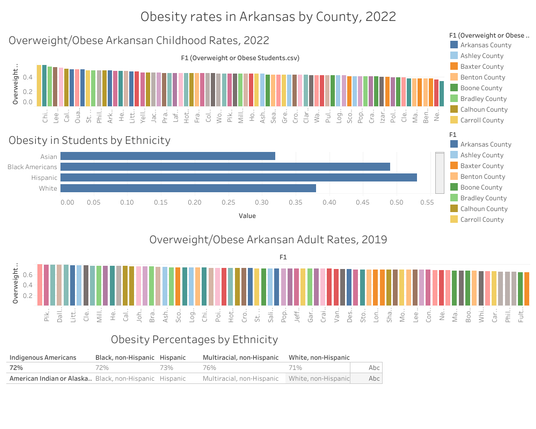
b.) Obesity in Arkansas with ethnicity data included.
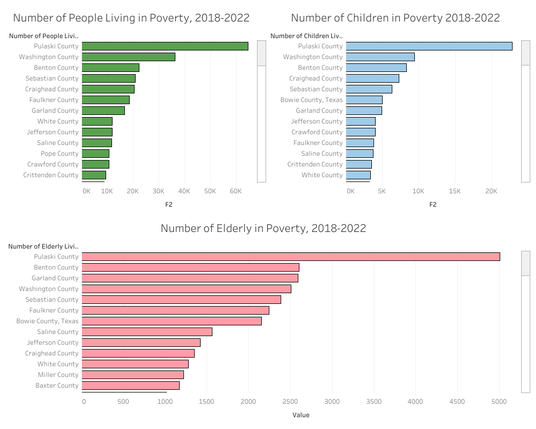
c.) Data on the amount of people experiencing poverty across the general public, children, and the elderly.
#gis #datavisualization #incomeinequality #poverty #arkansas #tableau #tableaupublic #data #dataanalysis