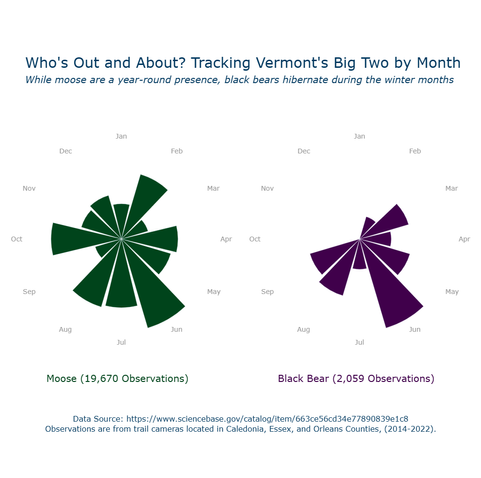
Diving into #Vermont wildlife for the #30DayChartChallenge "circle" day! 🦌 Using #Python & #plotly to compare monthly #Moose and #BlackBear sightings 🐻 Data wrangled with #BigQuery and #SQL. Any guesses which animal is seen more consistently throughout the year? 😜 #DataViz #Wildlife #RadialChart