🔴⚫️ Brinton, Willard Cope. Graphic presentation. New York city, Brinton associates, 1939.
Topics
#GraphicDesign #charts #FlowMaps #datavis
at @internetarchive
https://archive.org/details/graphicpresentat00brinrich/mode/2up
🔴⚫️ Brinton, Willard Cope. Graphic presentation. New York city, Brinton associates, 1939.
Topics
#GraphicDesign #charts #FlowMaps #datavis
at @internetarchive
https://archive.org/details/graphicpresentat00brinrich/mode/2up
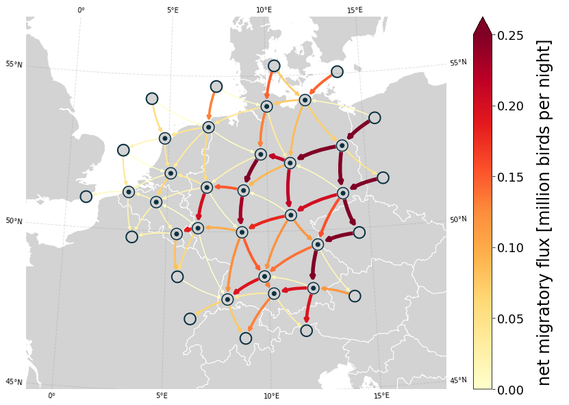
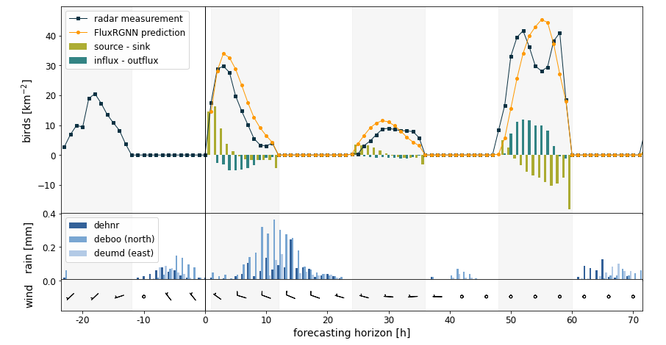
Every once in a while, I stumble over a paper that has really nice figures, that make me curious to learn how they were created
Fiona Lippert et al.'s "Learning to predict #spatiotemporal #movement dynamics from weather radar networks" is definitely one of them
Luckily they provide their plotting code at https://github.com/FionaLippert/FluxRGNN/blob/v.1.1.1/notebooks/radar_case_study.ipynb for all of us to learn from
#OpenScience #FlowMaps #Mapping #GIScience #MovementEcology #MovementDataScience
#Design #Tools
Six useful abstractions · Ways to express your design intent through maps and models https://ilo.im/14c1ik
_____
#IA #ProductDesign #UxDesign #UiDesign #WebDesign #Content #Classifications #Visualizations #Diagrams #Models #Maps #ConceptualModels #ContentModels #ExperienceMaps #EcosystemMaps #SiteMaps #FlowMaps
For the week of 2023-01-30, the #MapPromptMonday is about making #FlowMaps, so I took one of the books I love when I was a kid: "Around the world in 80 days" by #JulesVerne, and made a map of the route taken by the protagonists, using data from #WikiVoyage.
#Rstats code at: https://github.com/jmcastagnetto/my_map_prompt_monday/tree/main/2023-01-30_flow-map


