Starting week two of a two-week+ conference circuit (my first real travel since COVID), and what I've noticed most is that I've lost all my time management skills!
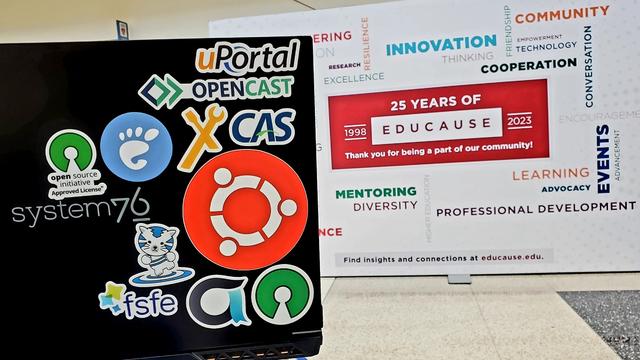
@Educause / #Educause23 / #EDU23 / #CLS / #AllThingsOpen / #AllThingsOpen2023 / @allthingsopen
Thank you @educause for a great event and all your hard work in planning and presenting #EDU23 / #Educause23. The staff were great, the sessions informative, and the community inspiring.
The U.S. National Security Agency/Central Security Service has just recommended vendor practices to support #OpenSource development and maintenance...
"Every organization using #OSS should support the OSS ecosystem, including by (see image attached).
My favorites:
1. Partnering with existing OSS Foundations and pursuing collaborative efforts
2. Participation in OSS and grant programs.
The National Security Agency (NSA) is joining U.S. federal partners to release cybersecurity guidance to promote understanding of open source software (OSS) implementation and provide best practices
Just heard at @Educause Annual Conference (#Educause23 #EDU23) that #NetNeutrality is coming back in the U.S.
Thanks to Jarrett Cummings for the good news!
https://www.latimes.com/business/story/2023-10-12/fcc-seeks-to-restore-network-neutrality-rules-trump-era-deregulation #OpenSource #EdTech #HigherEd #HigherEducation
Interesting graphic from D'Arcy Norman (@dnorman) displaying the categories and number of exhibitors at Educause (#EDU23, #Educause23). I wonder if these follow or push #highered #edtech? It would be interesting to overlay this with Educause's annual "Top IT Trends" reports.
Justin posted a thing on listedtech, looking at historical “big booth” presenter data from the EDUCAUSE annual conference, with data from 2012-20221. It’s an interesting approach, but the charts he used didn’t make it easy to see if there was anything going on. Any trends? Shifts? Gaps? So, I took a couple of minutes to throw the data into Numbers and created the 2 visualizations I was looking for in the article.