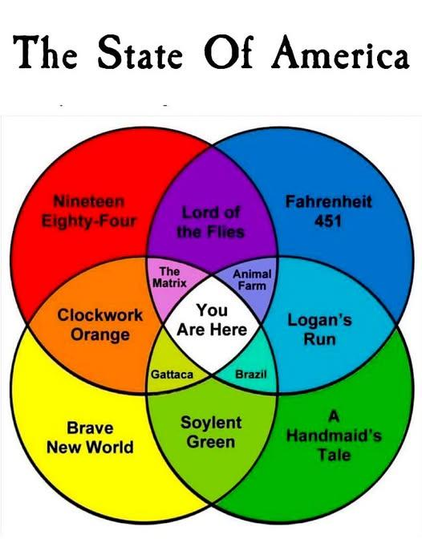
I'm going to need people who have no fucking clue how Venn diagrams work to please refrain from making them. The first image is an atrocity shared by a friend on FB (and that friend is not responsible for the abomination, and is a good person so I'm not posting this back on FB).
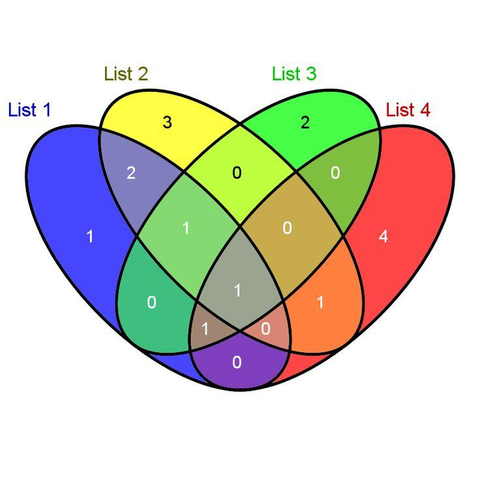
The second image is a proper Venn Diagram (one of several possibilities, I think, but the most common one).
The shitshow, the omnishambles, the clusterfuck...
- How is Clockwork Orange a combination of 1984 and Brave new World?
- How is Logan's Run a combination of Fahrenheit 451 and Handmaid's tale?
- How in green blazes is Gattaca a combination of clockwork orange, Soylent Green, and Brave New World?
- Et Goddamn Cetera
NONE of the overlaps make any sense. Whoever made this just threw scary book and movie titles in spaces. They should not even be informed of the existence of the proper 4-category Venn. They have proven themselves deeply unworthy.
I am guyjantic and I approve this unhinged rant about an inconsequential matter.
#rant #venndiagram #DataIsUgly #BadGraph #ForShame #Petty #soapbox