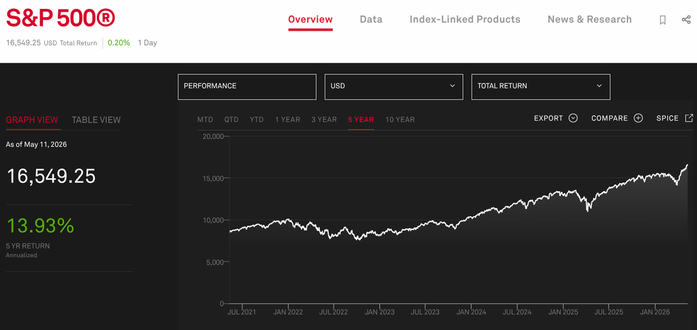
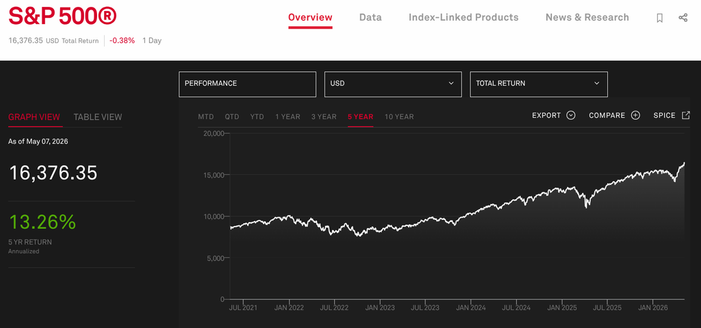
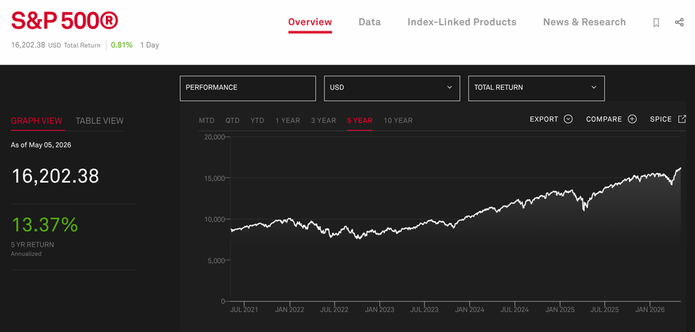
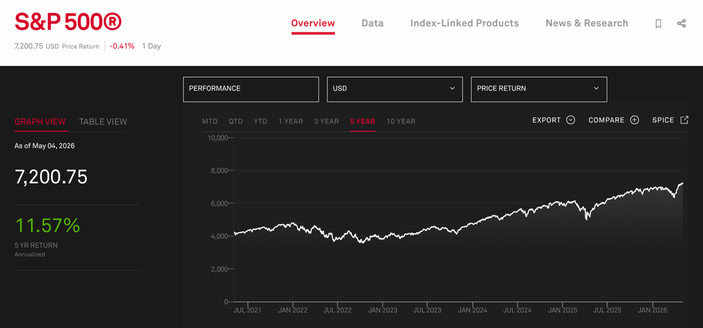
The 8:35a Chart| Given the importance of Permanent Fund returns to #AKrev levels, we have developed a second morning chart comparing the S&P 500 5-, 3- & 1-yr returns to the PFC's. #akleg
* 5-yr: S&P 13.80% v PFC 6.58%
* 3-yr: S&P 23.12% v PFC 8.63%
* 1-yr: S&P 26.75% v PFC 11.10%