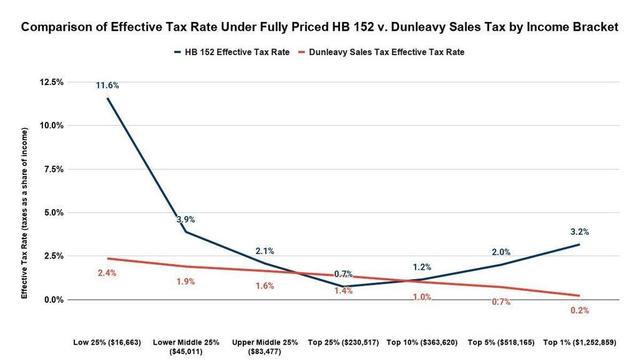
Monthly PFC Performance Charts| Consistent with our recent columns on PFC performance, we are revising our monthly charts that look at the performance of the Permanent Fund against various benchmarks (background: https://bit.ly/43H7gbM). #akleg
1/3
The 8:30a Chart| To provide context to current $$oil, we publish daily (ex-Su) a running avg of FY26-32 $$ANS, Brent & WTI actual+futures. Projected ANS v. SPRING26 rev F'cast:
> FY26 ⬆️ $3 (+$132mil UGF)
> FY27 ⬆️ $5 (+$220mil)
> FY28-32 ⬆️ $1 (avg annual +$69mil)
#akleg
The Thursday Charts| We publish two charts Thursdays. #akleg
Using the prior yr's production profile as a baseline, the first charts YTD production levels compared w/the most recent F'cast (now SPRING26). W/75% of FY26 done, YTD avg (red) running -5kbd (-1%) v. F'cast.
1/2
USWC Supply Chart| Monthly as data becomes available from EIA we take a look at supply sources into PADD V (USWC) refineries. #akleg
YTD (thru Jan), Alaska running ⬆️ 2.2% v. 2019 USWC mkt share (21.1% v 18.9%), but due to lower demand, vols ⬇️ 20kbd (428kbd). US sources 40% of total USWC supplies.