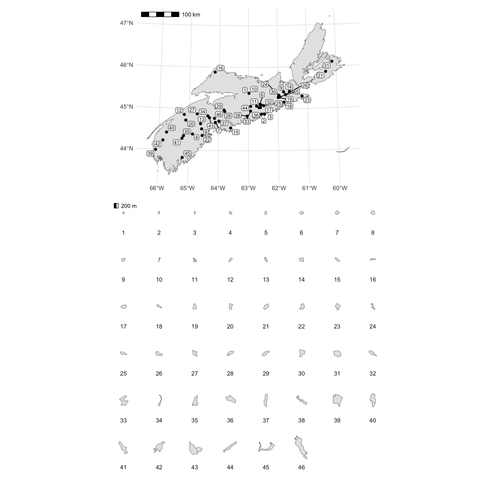
For Day 24 of the #30DayMapChallenege it's Place Names, so obviously I had to plot all of the "Mud Lake"s of Nova Scotia I could find! Here I use the SedonaDB R bindings because I use the #RStats packages ggplot2, ggspatial, ggrepel, and patchwork for the cartography. The Nova Scotia boundary here is from Overture Maps Foundation "divisions" and I was pleased that interacting with it in R was just as snappy as in Python! https://dewey.dunnington.ca/post/2025/day-24-the-mud-lakes-of-nova-scotia/

#Projections for #30DayMapChallenege

An animation of 24 hours (from midnight at UTC+00:00) on Earth today, in four different projections: Left to right, top to bottom: #Orthographic, #Stereographic, Interrupted Goode Homolosine and #Spilhaus.

Plotted with #cartopy 's Nightshade function (repeated calls to get the different twilight zones) and #matplotlib at 15 minute time steps and then stacked together in #gimp

Background image is cartopy's `stock_img()`.

re-used some code I threw together recently to make a thing for changing my desktop background: https://tlohde.com/blog/2025/10/because-i-cant-afford-a-geochron/

#theTerminator #twilightZones #blog #geochron

Day 6 of the #30DayMapChallenege is Dimensions! Here I create a beautiful, clean space-time dataset with M values and a proper temporal CRS with SedonaDB...and then completely ignore it because I couldn't find a tool that can animate based on M values (let me know if there is one!). The data here are positions of floats from from the Argo ocean floats program (here roughly 2003 to 2025). Walkthrough in the comments! https://dewey.dunnington.ca/post/2025/day-6-dimensions/
Day 5 of the #30DayMapChallenege! In which I attempt simple LiDAR processing for the first time using SedonaDB. Behold...a high-resolution elevation map of what's under my feet in my hometown of Winnipeg, Manitoba. Getting the data here is an example of where Arrow shines...we don't have a built-in LAS reader yet but we can patch one in using a dozen lines of Python. Code + walk through in comments! https://dewey.dunnington.ca/post/2025/day-5-earth/
#30DayMapChallenege day two is lines! Here's an animated version of the stream traversal with SedonaDB post I made a few weeks ago but using the Gaspereau River, which drains Gaspereau Lake (featured in day one). https://dewey.dunnington.ca/post/2025/day-2-lines/
Day 2: Lines | Dewey Dunnington

Day two of the 30 day map challenege is lines! A few weeks ago I wrote a post about stream traversal with SedonaDB. For day two I’ll do this with the river system for Gaspereau Lake (starting at the mouth of the beautiful Gaspereau River!

Dewey Dunnington

Day 1 of the #30DayMapChallenege is points! This one is entitled "Always Plot Your Test Data"...I've been using a dataset called ns-water_point for a long time without properly inspecting it. It turns out the points are almost all...

Rocks! They're pretty much all rocks. This one is a map of the rocks of Gaspereau Lake, Nova Scotia. If you've ever boated there you have probably run into one of them (I certainly have!). https://dewey.dunnington.ca/post/2025/day-1-points/