EuroVis 2025 Call for Full Papers: Please submit your papers to @EuroVis Abstracts due Thursday Nov 27 2024 (AoE). https://www.eurovis.org/
| Homepage | http://icmt.fhstp.ac.at/en/team/wolfgang-aigner |
| Homepage | http://icmt.fhstp.ac.at/en/team/wolfgang-aigner |
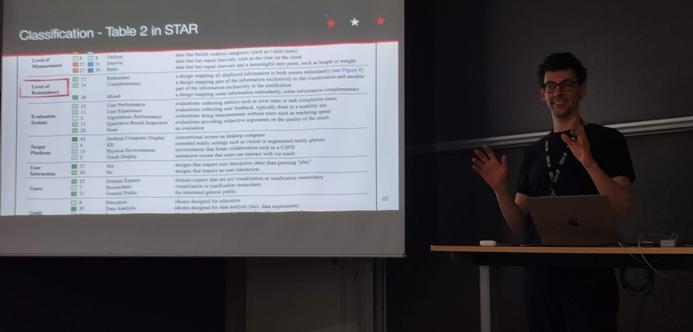

The research communities studying visualization and sonification for data display and analysis share exceptionally similar goals, essentially making data of any kind interpretable to humans. One community does so by using visual representations of data, and the other community employs auditory (non-speech) representations of data. While the two communities have a lot in common, they developed mostly in parallel over the course of the last few decades. With this STAR, we discuss a collection of work that bridges the borders of the two communities, hence a collection of work that aims to integrate the two techniques into one form of audiovisual display, which we argue to be "more than the sum of the two." We introduce and motivate a classification system applicable to such audiovisual displays and categorize a corpus of 57 academic publications that appeared between 2011 and 2023 in categories such as reading level, dataset type, or evaluation system, to mention a few. The corpus also enables a meta-analysis of the field, including regularly occurring design patterns such as type of visualization and sonification techniques, or the use of visual and auditory channels, showing an overall diverse field with different designs. An analysis of a co-author network of the field shows individual teams without many interconnections. The body of work covered in this STAR also relates to three adjacent topics: audiovisual monitoring, accessibility, and audiovisual data art. These three topics are discussed individually in addition to the systematically conducted part of this research. The findings of this report may be used by researchers from both fields to understand the potentials and challenges of such integrated designs while hopefully inspiring them to collaborate with experts from the respective other field.
🎁Our Christmas gift for you:
📖 The second edition of our book "Visualization of Time-Oriented Data" is finally available. Read it for free, it is Open-Access!
📇 Also check out the updated version of the online "TimeViz Browser", a catalogue with more than 150 visualization techniques.
@wolfgangaigner @EuroVis Less barriers is good for us new-bies. Complex procedure & requirements are difficult for us interdisciplinary scientists!
(disclosure, mine was the first ever paper to get desk-rejected by organiser apparently. Mostly because I had no idea...)
📣 We're hiring! Seeking candidates for a PhD position in Situated Visualization of Cultural Heritage Data 🏛️
Bring history to life! Explore the realm of AR to visually represent cultural heritage data in the physical world.
📩 Apply now! Don't miss out on this exceptional opportunity to revolutionize cultural heritage visualization through AR. Together, let's create a virtual bridge to the past.
http://www.visual-heritage.at/team/open-positions-phd-students
#PhDPosition #AR #CulturalHeritage #SituatedVisualization #JobOpportunity