Wade Baker

@wade@infosec.exchange
428 Followers
144 Following
181 Posts
#InfoSec researcher and data storyteller; Cyentia Institute (@cyentiainst) co-founder; Virginia Tech professor; Verizon DBIR and VERIS creator; Advisor for RSA Conference and FAIR Institute; Star Wars fanboi; Coffee addict; Beer and cocktail snob; Father of 5.

I use this account on occasion to share and discuss research findings I consider informative and/or useful. Typically more active on LinkedIn: https://www.linkedin.com/in/drwadebaker

Is your organization now more or less likely to experience a significant #cybersecurity event than it was 10y ago?

Well, that depends. Let's look at some data from Cyentia Institute's recent 2025 Information Risk Insights Study (IRIS).

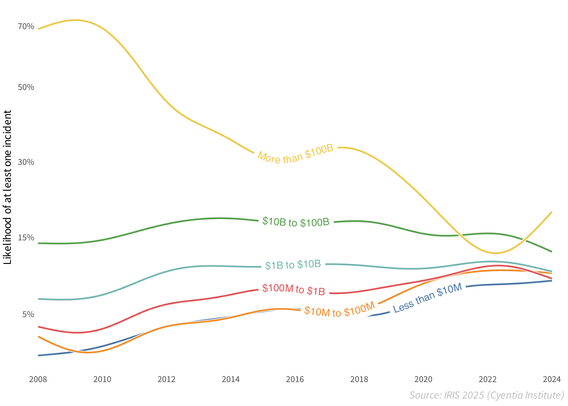
The chart below depicts the annualized incident probability for firms in each revenue tier. I won't go into the details here of how we modeled this, but the methodology appendix in the report does get into that (link below). And if you want even more detail, Joran Elias has an excellent blog post for Cyentia Institute members (free account). For now, just assume we've used many incidents over many years to model the probabilities you see here.

From the chart, you can see why I say "that depends" to the lead question. The probability of a <$100M firm suffering a #securityincident has more than doubled, while the chance of a $100B+ megacorporation having an event has dropped by a third over the same time frame. Meanwhile, incident probability for organizations in $1B to $100B range have remained relatively static.

Unfortunately, our dataset is silent on the underlying factors behind these #cyberevent trends, but we can engage in some informed speculation. And LinkedIn is the perfect platform for it. I'll start.

To me, this chart hammers home Wendy Nather's concept of the security poverty line. Giant corporations with their giant budgets to hire the best people, buy the best technology, and implement the best processes, are finding success. But the pace of digitalization has outpaced SMBs’ ability to defend their growing attack surfaces and mitigate #cyberrisk .

I have many other thoughts regarding the factors underlying what we see here, but I'd rather hear from you. What do you see as key contributors?

****
Get the IRIS 2025 here: https://www.cyentia.com/iris2025/

You'll have the option to just download it or get it or join Cyentia's free membership program for the report plus a bunch of bonus analytical content.

Are #cybersecurity incidents growing more costly?

Cyentia Institute's recent Information Risk Insights Study points to a 15-fold increase in the cost of #incidents and #databreaches over the last 15 years.

The chart on the left shows the distribution of known/reported financial losses from incidents across the time period of the study. The typical (median) incident costs about $600K, while more extreme (95th percentile) losses swell to $32M. Note that the chart uses a log scale, so the tail of large losses is a lot longer than it appears.

The chart on the right trends the escalating costs of cyber events over time. Median losses from a security incident have absolutely exploded over the last 15 years, rising 15-fold from $190K to almost $3 million! The cost of extreme events has also risen substantially (~5x). So, yeah—cyber events are definitely growing more costly.

That said, this picture looks a lot different among different types and sizes of organizations. How are financial losses and other #cyberrisk factors trending for orgs like yours?

Download the full IRIS 2025 to find out!
Free with no reg req'd - though you can join Cyentia's free membership forum for bonus analytical content related to the report.

https://www.cyentia.com/iris2025/

Are security incidents becoming more common? That's the first question we seek to answer in the upcoming 2025 Information Risk Insights Study. Check out this article for a preview. #breaches #incident #cyberrisk

https://www.linkedin.com/pulse/security-incidents-becoming-more-common-wade-baker-ph-d--navhe

Are security incidents becoming more common?

To many of you, the answer to this question seems so obvious that it’s hardly worth asking. But we’re not ones to let any assumption go unchallenged.

Presenting this morning at #RSAC2025 on findings from a massive study analyzing long-term cyber loss trends.

https://path.rsaconference.com/flow/rsac/us25/FullAgenda/page/catalog/session/1727461550962001LYM8

US25-Header

RSA Conference

Cyber risk is not evenly distributed across users in your workforce. In fact, it's very lopsided. A large majority of risk events in your organization probably tie back to a relatively small population of users.

The attached figures provide some stats supporting that statement:

- Just 1% of users are behind 44% of all clicked phishing emails. 5% of users are responsible for 83.4% of all clicks.

- 1% of users are behind 92% of all malware events! 5% of users are responsible for ALL malware events. The remaining 95% had a clean record.

I don't think the proper response to these statistics is to grab torches and pitchforks and go round up these users to purge them from among us. Rather, these results present an opportunity to have a big impact on risk reduction by doing more focused/effective job of educating, incentivizing, and influencing the behavior we want to see among the riskiest users.

Full report "Exposing Human Risk" from Mimecast and Cyentia Institute is available here (no reg req'd): https://assets.mimecast.com/api/public/content/mimecast-exposing-human-risk

#cybersecurity #cyberrisk #insiderthreat #malware #phishing

I'm fascinated by the concept of measuring attacker-defender advantage in software, devices, and even entire IT environments. What do I mean by "attacker-defender advantage?" Lemme sum up and then share a chart.

Let's say you could measure the speed at which defenders remediate various types of security vulnerabilities across all relevant assets. Then say you could detect and measure the speed at which attackers find/exploit those vulnerable assets across the target population of organizations using them. Finally, plot those curves (across time and assets) to see the delta between them and derive a measure of relative advantage for attackers and defenders. That relative value is what I mean by attacker-defender advantage.

Since a picture is worth a thousand words, here's a visual example of the concept. The blue line represents defenders, measuring the speed of remediation. Red measures how attacker exploitation activity spreads across the target population. When the blue line is on top, defenders have a relative advantage (remediating faster than attackers are attempting to exploit new targets). When red's on top, the opposite is true. The delta between the lines corresponds to the relative degree of advantage (also expressed by the number in the upper left).

This chart comes from prior Cyentia Institute research in which we were able to combine datasets from two different partners (with their permission). Unfortunately, those datasets/partners are no longer available to further explore this concept - but maybe this post will inspire new partnerships and opportunities!

Any surprises in the attacker-defender advantage results depicted in the chart? Has anyone measured this or something similar?

#cybersecurity #vulnerabilities #cyberattacks #infosec #exploitation

Not all Cybersecurity stats are Cybersecurity facts
Cybercrime 10.5T, Cyber shortage 3.4m, ..

Cybercrime ✅@Rand ❌@CybersecuritySF @Forbes @WSJ
Cyber talent shortage ❌@ISC2
Databreach Costs ✅@cyentiainst ❌@IBM @Ponemon

Thrilled to have the opportunity to analyze #vulnerability remediation timelines again, this time using data from NopSec. The chart below is based on a survival analysis of vulnerabilities across an environment. Essentially - the time it takes to remediate all affected assets after a vuln is discovered.

Every time I'm involved in analysis like this, I'm reminded of how different the real world of #vulnerabilitymanagement is from the shallow advice that's so often bandied about: "Just patch it all yesterday." If it were that easy, vulnerability survival curves wouldn't look like this time after time.

How does this square with your experience?

I'll be discussing this chart and several others in a webinar next week. Register here and bring your questions, comments, and rants!

https://www.nopsec.com/resources/webinars/2024-state-of-exposure-management/

NopSec Webinar: 2024 State of Exposure Management - Resources - NopSec

- View NopSec Resources.

NopSec

Earlier this year, Cyentia Institute published a meta-study analyzing the top ATT&CK techniques reported across 20+ industry sources. NOT ONE OF THEM reported observing T1195.003 - Compromise Hardware Supply Chain.

Hold on...my aid has an urgent message for me...oh...really?...I see...got it...

Sorry for the interruption. As I was saying, T1195.003 was THE MOST REPORTED sub-technique in the entire study!

Download it today from the compromised device of your choice: https://www.cyentia.com/multi-source-analysis-of-top-mitre-attck-techniques/

#supplychain #cybersecurity #fud

Multi Source Analysis of Top MITRE ATT&CK Technique - Cyentia Institute | Data-Driven Cybersecurity Research

Recent analysis of MITRE ATT&CK techniques uncovered significant gaps in reporting, emphasizing comprehensive threat-informed defense needs.

Cyentia Institute | Data-Driven Cybersecurity Research
Safety warnings in my house:
×

Earlier this year, Cyentia Institute published a meta-study analyzing the top ATT&CK techniques reported across 20+ industry sources. NOT ONE OF THEM reported observing T1195.003 - Compromise Hardware Supply Chain.

Hold on...my aid has an urgent message for me...oh...really?...I see...got it...

Sorry for the interruption. As I was saying, T1195.003 was THE MOST REPORTED sub-technique in the entire study!

Download it today from the compromised device of your choice: https://www.cyentia.com/multi-source-analysis-of-top-mitre-attck-techniques/

#supplychain #cybersecurity #fud