Is your organization now more or less likely to experience a significant #cybersecurity event than it was 10y ago?
Well, that depends. Let's look at some data from Cyentia Institute's recent 2025 Information Risk Insights Study (IRIS).
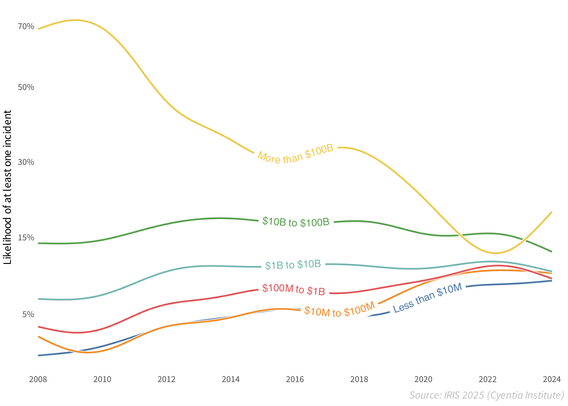
The chart below depicts the annualized incident probability for firms in each revenue tier. I won't go into the details here of how we modeled this, but the methodology appendix in the report does get into that (link below). And if you want even more detail, Joran Elias has an excellent blog post for Cyentia Institute members (free account). For now, just assume we've used many incidents over many years to model the probabilities you see here.
From the chart, you can see why I say "that depends" to the lead question. The probability of a <$100M firm suffering a #securityincident has more than doubled, while the chance of a $100B+ megacorporation having an event has dropped by a third over the same time frame. Meanwhile, incident probability for organizations in $1B to $100B range have remained relatively static.
Unfortunately, our dataset is silent on the underlying factors behind these #cyberevent trends, but we can engage in some informed speculation. And LinkedIn is the perfect platform for it. I'll start.
To me, this chart hammers home Wendy Nather's concept of the security poverty line. Giant corporations with their giant budgets to hire the best people, buy the best technology, and implement the best processes, are finding success. But the pace of digitalization has outpaced SMBs’ ability to defend their growing attack surfaces and mitigate #cyberrisk .
I have many other thoughts regarding the factors underlying what we see here, but I'd rather hear from you. What do you see as key contributors?
****
Get the IRIS 2025 here: https://www.cyentia.com/iris2025/
You'll have the option to just download it or get it or join Cyentia's free membership program for the report plus a bunch of bonus analytical content.


