@tabmap

11 Followers
8 Following
18 Posts

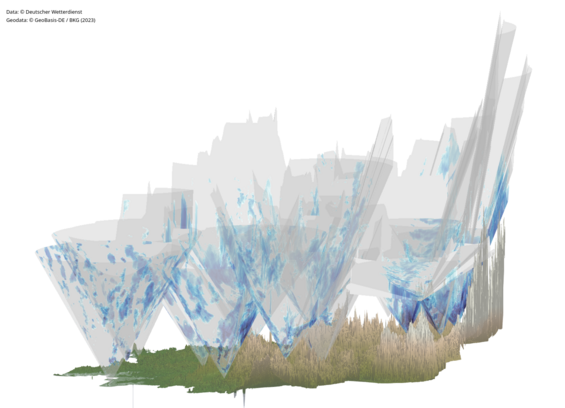
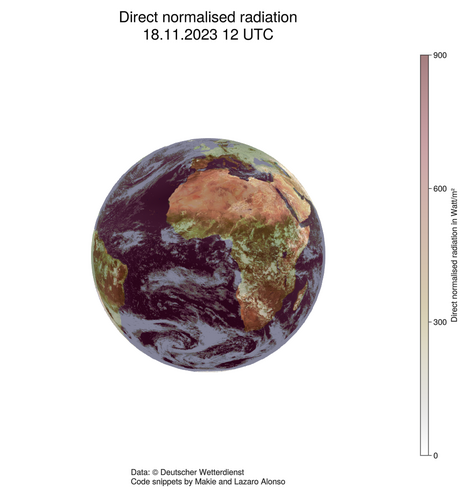
My last and favourite map for Day 30 of the #30DayMapChallenge (I know I am a bit late...)
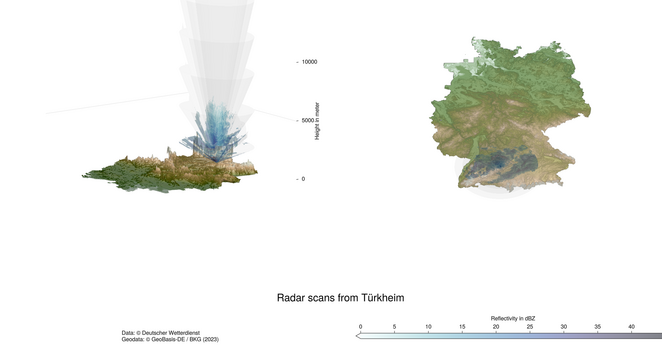
The German weather radar network operated by the @DeutscherWetterdienst with its precipitation scan. It follows the orography if you look closely.

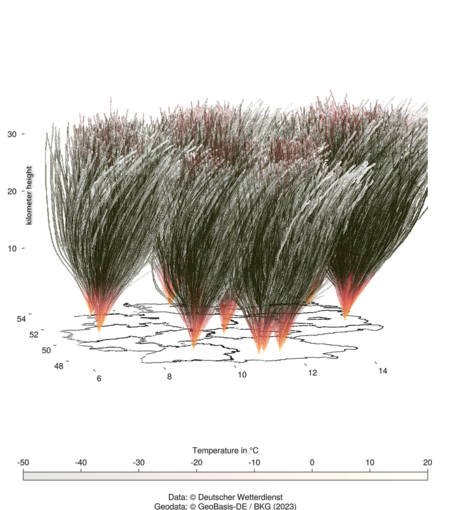
Unfortunately, I wasn't able to do all of the maps, in the end it took much more time than I'd expected... But it was fun to work with new data and also the first time in 3d with @makie. Code for the plots and links to the data: https://github.com/TabeaW/30daymapchallenge_2023

GitHub - TabeaW/30daymapchallenge_2023

Contribute to TabeaW/30daymapchallenge_2023 development by creating an account on GitHub.

GitHub
Day 27: Dots of the #30DayMapChallenge
As you liked the plot of the radiosonde ascents with data by @DeutscherWetterdienst a lot (https://mastodon.social/@tabmap/111431368370022432). I thought, I'll give you another look at it from the top. So here it is, all radiosonde ascents in this year. Color visualizes the amount of data points.
Did with @makie and #julialang.
Day 24: Black & White of the #30DayMapChallenge
Today with snow data of the @DeutscherWetterdienst. In the map you can see the triangulated station data and where you could expect white christmas ;)
Did with @makie and #julialang .
Code is available at https://github.com/TabeaW/30daymapchallenge_2023
GitHub - TabeaW/30daymapchallenge_2023

Contribute to TabeaW/30daymapchallenge_2023 development by creating an account on GitHub.

GitHub
Day 23: 3D of the #30DayMapChallenge
We have another look at weather radar data by the @DeutscherWetterdienst. Each radar does 10 volume scans and one precipitation scan which follows the orography in 5 minutes. Here we see one radar (Türkheim) with all 11 scans.
Did with @makie and #julialang. Code is available https://github.com/TabeaW/30daymapchallenge_2023.
GitHub - TabeaW/30daymapchallenge_2023

Contribute to TabeaW/30daymapchallenge_2023 development by creating an account on GitHub.

GitHub
Day 21: Raster of the #30DayMapChallenge
Today with a gif of the 5min rainfall sums in Germany based on radar measurements of the last two days. Data by @DeutscherWetterdienst. Did with @makie and #julialang. Code can be found here: https://github.com/TabeaW/30daymapchallenge_2023
GitHub - TabeaW/30daymapchallenge_2023

Contribute to TabeaW/30daymapchallenge_2023 development by creating an account on GitHub.

GitHub
Day 18: Atmosphere of the #30DayMapChallenge
I didn't want to bring a standard map again. So I played a bit more with the 3D possibilities in @makie. With much help of the @makie documentation and Lazaro Alonsos https://beautiful.makie.org the plot for the direct normalised radiation (data by @DeutscherWetterdienst) measured by satellite came out.
A bit late, as the large amount of data was a pain to visualize. Day 17: Flow of the #30DayMapChallenge
Here you can see the radiosonde ascents (@DeutscherWetterdienst) of this year in Germany. Quite good to see, that most of them drift eastwards.
Did with @makie and #julialang
Day 15: Openstreetmap of #30DayMapChallenge
Today we have a look at the roads (green lines are motorways) and their forecasted surface temperature in mid Germany. With data from @DeutscherWetterdienst and Openstreetmap.
Did with @makie and #julialang
Day 14: Europe of #30DayMapChallenge
Today we are looking from space to Europe. SEVIRI data from CM SAF @DeutscherWetterdienst show that we need to go close to the end of the earth (Cape Finisterre) if we don't want clouds in February.
Did with @makie and #julialang. Code is available at https://github.com/TabeaW/30daymapchallenge_2023
GitHub - TabeaW/30daymapchallenge_2023

Contribute to TabeaW/30daymapchallenge_2023 development by creating an account on GitHub.

GitHub
Day 13: Choropleth of #30DayMapChallenge
Today with heat warnings of the @DeutscherWetterdienst from 2005-2023. As the forecasting changed over the years, this cannot be used for trend analyses!
Did with @makie and #julialang.