Day 27: Dots of the #30DayMapChallenge
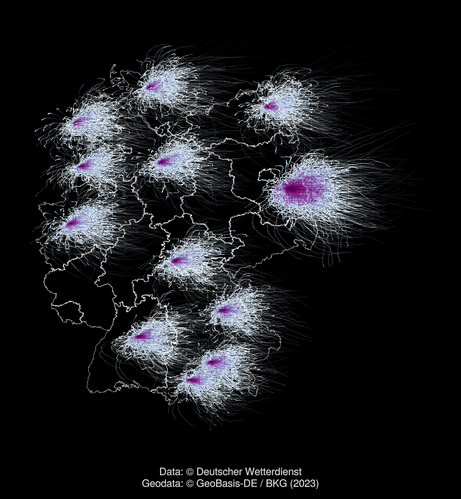
As you liked the plot of the radiosonde ascents with data by @DeutscherWetterdienst a lot (https://mastodon.social/@tabmap/111431368370022432). I thought, I'll give you another look at it from the top. So here it is, all radiosonde ascents in this year. Color visualizes the amount of data points.
Did with @makie and #julialang.