Charles OuGuo

42 Followers
108 Following
1.3K Posts
Newly-minted Canadian! Software engineer on developer tooling @stripe. SFSU math. Do good recklessly.
Websitehttps://seinmastudios.com
The @showuptoronto newsletter is switching to a Thursday schedule! Subscribe to get a weekly digest of all the events on the calendar, along with whatever's on my mind that week. This week, it's supervised consumption sites and not hardening your heart https://buttondown.com/showup/archive/show-up-toronto-march-19-2026/ #toronto
Show Up Toronto - March 19, 2026

Hi friends and neighbours, You may have noticed this newsletter is coming to you two days later than usual. This is because Show Up is switching to a...

Show Up Toronto
huh. i missed the big anniversary like a couple of weeks ago, but https://interfluidity.com is twenty years old this month. i'm on a bit of a hiatus as my life is overwhelmed by other things, but i'm still blogging after all these years. https://drafts.interfluidity.com/archive.html
interfluidity

Guided Meditation for Developers

A practice for finding peace in your dependency tree.

Andrew Nesbitt

Last month I asked for recommendations for graph layout tools. Thanks to everyone who suggested something! I've now finished the task I wanted them for, so have some pretty (ish) pictures.

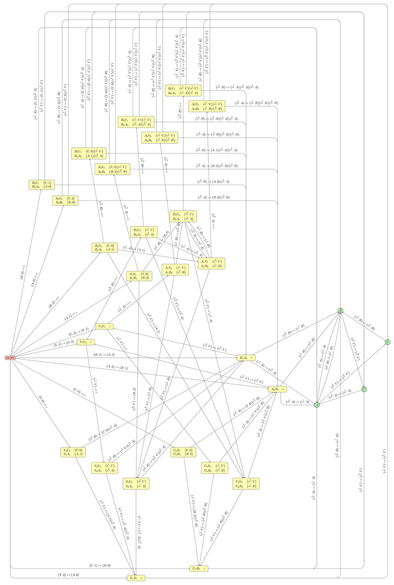
In the end, I didn't use anything more complicated than Dotty, and I didn't even use Dotty on the _full_ version of either of my graphs. I was able to condense each graph to a simpler one by merging sets of vertices that had some semantic properties in common; then I used Dotty to lay out _those_ graphs (essentially using it like Untangle, but easier to remember which vertex was which), and then I did the manual layout of the full graph by re-expanding each vertex into a cluster of nearby ones and moving things about until everything fitted. So in the final layout, related vertices are grouped together, which shows something of the structure of each diagram.

That wasn't at all what I'd _expected_ to do. I had hoped to illustrate the relations between vertices by giving the whole graph symmetry, so that related vertices were images of each other in two reflective axes, or something similar. Clustering the related things together was a fallback option after that didn't go anywhere. But I think it ended up legible.

Just to show the difference, the third image in this post is essentially the same state machine as the second image – both are finite-state transducers for the Penrose P2 tiling using Robinson triangles. But the third image is how Graphviz laid it out when I let it do the whole job itself, for my 2024 blog post. However complicated you find my new hand-drawn version, I hope you'll at least agree that it's clearer than that!

can this be a solution

A small thing making me happy this spring:

The Northern Flickers in my neighborhood (think: woodpecker’s cousin) have figured out that if they rap their bills on the top of the street lamps it makes a great noise that travels far. They seem to be using it as a supplement to their usual calls. So, walking to school I’ll hear four or five Flickers alternating between vocal calls and street lamp percussion. 🥁
#birds #tools #drums

My local free outdoor Shakespeare company in Toronto is doing a fundraiser where they will perform a condensed version of the wedding scene from MacBeth over and over. The more money they raise, the longer they’ll go and the weirder it will get.

It’s free to drop in and watch (but really you should donate if you do). It’s at the Video Cabaret in Leslieville (10 Busy Street, Toronto). The performance will start at 1:30pm on April 12, and run for a minimum of two hours.

#Toronto #Shakespeare