Michiel Duvekot

104 Followers
395 Following
181 Posts
Yes, there will also be singing
About the dark times
dataviz
(he/him)

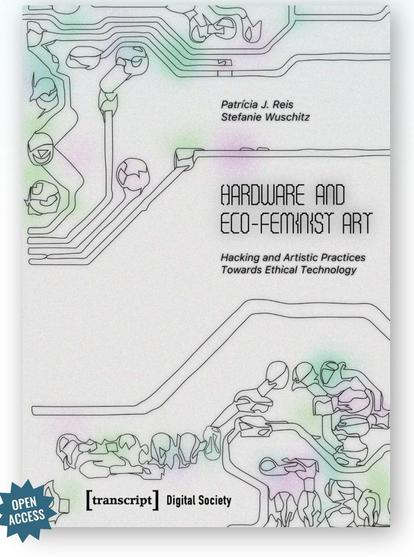
Finally our book is published and ready for free download (Open access)

https://www.transcript-verlag.de/978-3-8376-7862-8/hardware-and-eco-feminist-art/

Thanks so much to all the people, communities and networks that helped us to do this!
#feministhardware
#transfeministhacking
#art
#Permacomputing
#degrowth
#artbasedresearch
#fwf_peek

@adhdeanasl THERE IS NO ABSOLUTE CONTEXT FROM THE STANDPOINT OF WHICH AN UNBIASED EVALUATION IS POSSIBLE!

oh my god this ad from Zohran Mamdani... https://www.burnsnotice.com/you-have-to-see-this-mamdani-ad/

I'm literally crying.

You Have to See This Mamdani Ad

I wasn't planning to post anything today. I dislike working and writing on weekends in general, but this was too important to ignore. You have to see this Zohran Mamdani campaign ad that came out this morning: It's an entire political ad, from a major Democratic politician, that is exclusively

Burns Notice

I've written a short blog post introducing "The Art of Visualization with ggplot2"!

This book is all about the end-to-end process of creating charts with #ggplot2 📊 including data wrangling, sketching, and styling your plots!

Blog post: https://nrennie.rbind.io/blog/art-of-viz-book/

Or just go straight to online version of the book: https://nrennie.rbind.io/art-of-viz/

#RStats #DataViz #TidyTuesday

Introducing The Art of Visualization with ggplot2 – Nicola Rennie

I’ve written a book! This blog post gives a brief introduction to The Art of Visualization with ggplot2, a book of data visualization case studies showing the end-to-end process of building charts, starting from data acquisition to custom styling, entirely in R.

Nicola Rennie

People who use screenreaders, I have a question about graphs as images in the Gender Census report.

Would you rather the alt text/image description was:

1) A very brief description such as "bar graph", and a link in the caption (under the image) to the Google Sheet containing the actual data and the graph

2) The numerical data as alt text, e.g. "nonbinary, 30%, 594. genderqueer, 25%, 456. etc."

3) Either of the above is fine

4) Something else that I have not anticipated!

#ScreenReaders

1) Brief description and link to Google Sheet
9.3%
2) The data itself as a list in the alt text
77.8%
3) Don't mind, either is fine
11.1%
4) Something else (replies welcome)
1.9%
Poll ended at .

Civic Spark is built by us — the civic tech community.

Join us Aug 16–17 for a volunteer-led gathering shaping the future of public life.

Full story → civictech.ca/announcements/civic-spark
Tickets → civic-spark.com

http://civictech.ca/announcements/civic-spark

@danwwilson now try round((0:10)+.5)
@DavidNapoli sure we can, just don't use any more bars

I am begging writers & writing-related-workers of all kinds—but especially people working in journalism and blogs—to stop using “AI art” to accompany your writing.

Please have solidarity with your fellow creative workers đź’ś

helped create a few maps of heat vulnerability in Toronto around this time last year

thought today's a good time to re-share

check out more here! - https://schoolofcities.github.io/heat-vulnerability-toronto/

#toronto #heat #maps