Mathijs Deen

@mathijsdeen
20 Followers
44 Following
19 Posts

#introductions

Hi Mastodon! 🐘

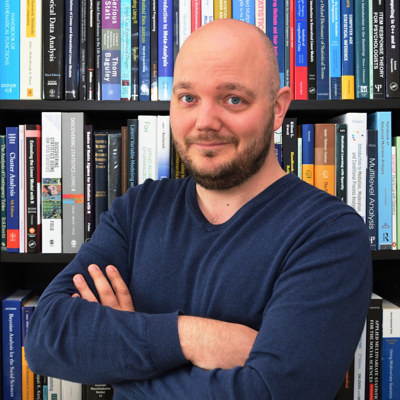
I'm Michèle, an assistant professor in psychological methods from the Netherlands. I’m looking forward to talk and read about my research interests here on Mastodon (but I will definitely get distracted by funny animals and DIY videos). Topics you’ll find on my timeline:

🔓 #openscience

🤖 #statcheck- a spellchecker for statistics

🔬 #metascience to improve psychological research

Looking forward to finding my way here!

How to find, display, and use built-in #rstats colors and pre-created palettes -- plus create your own palettes and palette functions.
https://www.infoworld.com/article/3615230/make-the-most-of-r-colors-and-palettes.html
#InfoWorld #DataViz
Make the most of R colors and palettes

How to find, display, and use 600 built-in R colors and 2000 palettes and create your own palettes and palette functions. Plus a bonus R Shiny app to display paletteer package palettes.

InfoWorld

Before my year ends: I have created a new website that details different strategies and designs for simulating missing data methodology. All code in the corresponding GitHub repo.

https://www.gerkovink.com/simulate/

May all your holidays be unsimulated!

Strategies for simulating missingness

It's all about data these days... #MemeMonday #StarTrek
I have been analyzing some data for a project (been a while), and really appreciate the easystats https://easystats.github.io/easystats/ packages. The report package is very useful (almost good enough to copy-paste in a paper if they drop the Cohen's benchmarks interpretation of effect sizes , but it is a great summary while running analyses) and the effectsize package is excellent. Great work!
Framework for Easy Statistical Modeling, Visualization, and Reporting

A meta-package that installs and loads a set of packages from easystats ecosystem in a single step. This collection of packages provide a unifying and consistent framework for statistical modeling, visualization, and reporting. Additionally, it provides articles targeted at instructors for teaching easystats, and a dashboard targeted at new R users for easily conducting statistical analysis by accessing summary results, model fit indices, and visualizations with minimal programming.

A colleague of mine in psychology recently shared with my the idea of "the troubling trio", characterized by: (1) low statistical power, (2) a surprising result, and (3) a p value only slightly less than 0.05. I hadn't heard this particular phrase before, so I'm sharing it. More people should know why the troubling trio is something to be troubled by, and should be on the lookout for this combination in their work. #datascience #stats #quant https://doi.org/10.1177/0956797615616374 (by @dstephenlindsay)
Excellent paper on why p-values are not measures of evidence by Johansson (that I missed when I wrote about the topic myself): https://onlinelibrary.wiley.com/doi/abs/10.1111/j.1467-9450.2010.00852.x

Registration is now open for the 'Evidence Synthesis and Meta-Analysis with R' conference (ESMARConf), which will run 27th to 31st March, 2023: https://esmarconf.org/events.html Remember that this conference is completely free (but you can make donations to support such activities). Really looking forward to this event!

#metaanalysis #evidencesynthesis #rstats #esmarconf

ESMARConf - Events

ESMARConf is a FREE, online annual conference series dedicated to evidence synthesis and meta-analysis in R. Our aim is to raise awareness of the utility of Open Source tools in R for conducting all aspects of evidence syntheses (systematic reviews/maps, meta-analysis, rapid reviews, scoping reviews, etc.), to build capacity for conducting rigorous evidence syntheses, to support the development of novel tools and frameworks for robust evience synthesis, and to support a community of practice working in evidence synthesis tool development. ESMARConf began in 2021 and is coordinated by the Evidence Synthesis Hackathon.

Still not worried that AI will take over my job #openai

Very helpful tutorial by @debruine on why learning to code, and how to write reproducible codes #coding #rstats. This video includes tips on:
1. Setting up file paths (relative path 👍 absolute path 👎 )
2. Naming files
3. Creating data documentation
4. Writing efficient codes with SPOT and DRY
5. Including test codes to make sure you data is as expected

https://youtu.be/w056yEMyJnE

Tips on how to review your code | Prof Lisa Debruine

YouTube