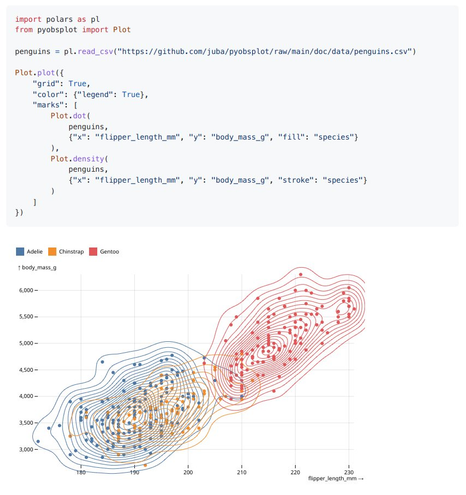
pyobsplot 0.3.7 is out, with Plot updated to 0.6.9.
pyobsplot is a #Python package which allows to use #ObservablePlot in jupyter notebooks and #quarto documents with a syntax as close as possible to the JavaScript one.
| GitHub | https://github.com/juba |
| Web | https://data.nozav.org |
pyobsplot 0.3.7 is out, with Plot updated to 0.6.9.
pyobsplot is a #Python package which allows to use #ObservablePlot in jupyter notebooks and #quarto documents with a syntax as close as possible to the JavaScript one.
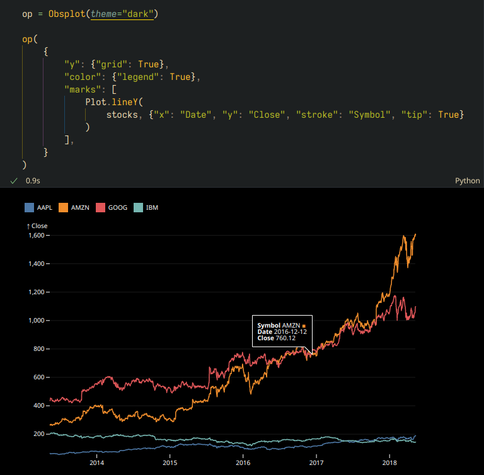
New pyobsplot 0.3.5 release. Plot has been updated to 0.6.8, allowing for tooltips and interactions (with the widget renderer only).
This version also introduces light and dark modes.
pyobsplot version 0.3.3 is out (pysobsplot is a #Python package which allows to use #ObservablePlot in notebooks and #QuartoPub documents).
The jsdom renderer now uses a local http server, improving rendering speed.
Full changelog: https://juba.github.io/pyobsplot/changelog.html
Repository:
https://github.com/juba/pyobsplot
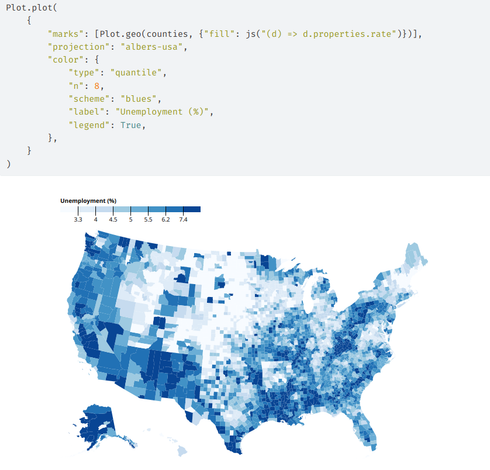
pyobsplot 0.3.2 is out. It allows to recreate these kind of #ObservablePlot charts, directly from #python, in notebooks or #QuartoPub documents, with a syntax as close as possible to the JavaScript one.
This version introduces default specification values and fixes the jsdom renderer on Windows.

Just published my first #quarto custom HTML format, called `bookup` :
https://github.com/juba/bookup-html
It provides a light and a dark theme, and should be suitable for single documents, book and website projects.
Feedback welcome !

