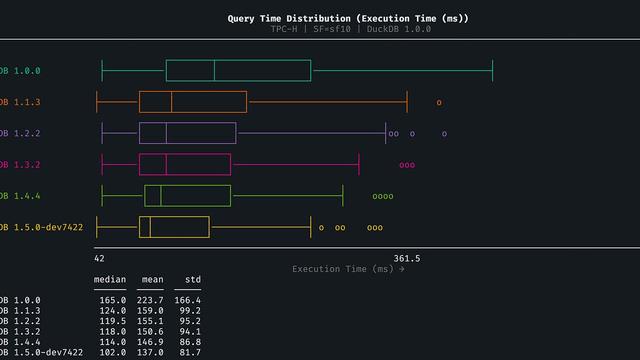
ICYMI, here’s my review of #DuckDB performance improvement from v1.0 to v1.5 (just released). https://oxbowresearch.com/p/how-much-faster-is-duckdb-15-vs-10
• You become what you are most measured by
• Performance @ Databricks

Technical choices worth noting:
- stdlib only: no numpy, pandas, etc.
- Terminal width detection, respects NO_COLOR
- CLI for piping JSON into any chart type
Feedback welcome, especially on the API design, feature gaps, and which chart types you find most useful.
I extracted `textcharts` from my benchmarking tool (BenchBox) where I need visualizations that work directly in a terminal session (SSH, CI logs, Claude Code, etc). No image viewers, no browser, no X11 forwarding.
PyPI: pip install textcharts
Docs: http://joeharris76.github.io/textcharts
pip install textcharts[mcp]
"textcharts histogram: commits/day, all branches."
textcharts — 15 chart types, zero dependencies, pure Python. The built-in MCP server means any compatible AI agent can generate charts from natural language.

Do we need yet another person crashing out about Apple’s design decisions? Am I doing it only because it’s fashionable to be on Apple Design Hate Train these days? I’ll be honest: I don’t know. But I have been bothered by Apple’s approach to some of its keyboard design for a while.
Even if you don’t care about any of this, it might be a fun visual history of the most tricky of modern modifier keys: the [Fn] key. Hope you like it!

> I want you to understand, regardless of your politics, the historical danger of a secret police. What happens when a militia is deployed in our neighborhoods and against our own people. Left unchecked their mandate will grow; the boundaries of acceptable identity and speech will shrink. I want you to think about elections in this future. I want you to understand that every issue you care about—any hope of participatory democracy—is downstream of this.
https://aphyr.com/posts/397-i-want-you-to-understand-chicago
Thanks, @aphyr