Für uns Anwender und Entwickler kommt #OpenData immer „irgendwie aus dem Portal“. Doch das auf die Beine stellen, das machen #Menschen. Auf dem #ODB26 Barcamp konnte ich viele kennenlernen und einige spannende Blickwinkel mitnehmen. Dank also an die Session-Hosts und an @BertelsmannStiftung fürs Ausrichten und die Gastfreundschaft!
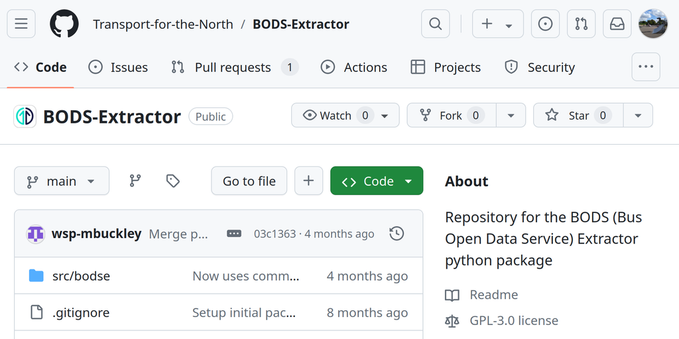
| Github | https://github.com/alexanderguentert |
| @TrickTheTurner |