Traders-Toolkit.com

@TradersToolkit
1 Followers
0 Following
1,015 Posts
πŸ€– MarketScope 360Β° πŸ“ˆ Top Market Movers | Heat Map | Charts | Stock Race | Alerts | News and More πŸ“‰ Get Free Access πŸ‘‰ https://go.traders-toolkit.com
MarketScope 360°​https://go.traders-toolkit.com
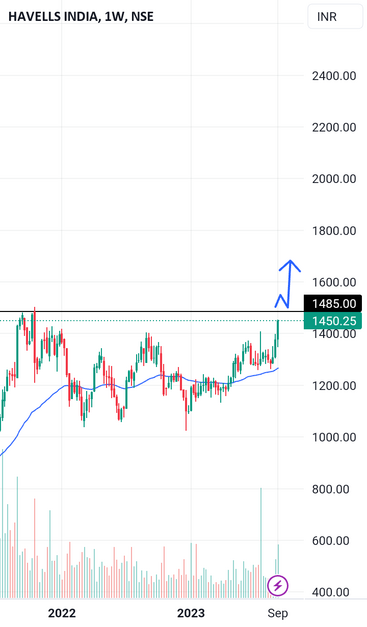
Havells: 1.50 moving average upside
2.volume increase
Target -1948
These are swing idea's which you can add your watchlist and analysis for yourself.
Keep on radar.
Potential upside stock!
This content for only education purpose!
I am not SEBI Register. http://dlvr.it/SvtGtD πŸ“Š Full Chart πŸ‘‰ #StockNews #tradingsignals #tradingstrategy #tradingtools #wallstreet
Havells

1.50 moving average upside 2.volume increase Target -1948 These are swing idea's which you can add your watchlist and analysis for yourself. Keep on radar. Potential upside stock! This content for only education purpose! I am not SEBI Register.

TradingView

$RIOT - Found support: NASDAQ:RIOT found support and is trading inside its previous consolidation area.

Oscillators are turning up.

A breakout above $12 is bullish and could see further upside.

A breakdown below $9.50 could see further downside to the $7.77 area.

Needless to say, the stock will follow the price of #Bitcoin.

Follow me for more charts and trade ideas. http://dlvr.it/SvtGbh πŸ“Š Full Chart πŸ‘‰ #stockcharts #tradingsignals #DayTrading #wallstreet #fundamentalanalysis

$RIOT - Found support for NASDAQ:RIOT by PaperBozz

NASDAQ:RIOT found support and is trading inside its previous consolidation area. Oscillators are turning up. A breakout above $12 is bullish and could see further upside. A breakdown below $9.50 could see further downside to the $7.77 area. Needless to say, the stock will follow the price of #Bitcoin. Follow me for more charts and trade ideas.

TradingView

TCS--@resistance Zone??: This stock has encountered persistent resistance within the 3460 range on multiple occasions. On the flip side, the price has consistently found support along a trendline, leading to upward movements.

It's advisable to maintain a bullish perspective as long as the price remains above this trendline. However, exercise caution, as there's a possibility of a false… http://dlvr.it/SvtCMQ πŸ“Š Full Chart πŸ‘‰ #StockMarket #fintech #StockScreener #SwingTrading #tradingcommunity

TCS--@Resistance Zone??

This stock has encountered persistent resistance within the 3460 range on multiple occasions. On the flip side, the price has consistently found support along a trendline, leading to upward movements. It's advisable to maintain a bullish perspective as long as the price remains above this trendline. However, exercise caution, as there's a possibility of a false breakdown below the trendline, which could mislead traders and necessitate a prudent approach before considering short positions.

TradingView

ITC--Trendline Resistance??: This particular stock has been on a prolonged bearish trend, but currently, the price is finding support within well-established historical support zones.

Looking ahead, there's a notable trendline resistance on the upper side. If the price manages to breach this trendline and subsequently provides a retest, it may present a favorable opportunity to consider long positions. http://dlvr.it/SvtBP5 πŸ“Š Full Chart πŸ‘‰ #ai #technicalanalysis #tradingtips #nyse #stocks

ITC--Trendline Resistance??

This particular stock has been on a prolonged bearish trend, but currently, the price is finding support within well-established historical support zones. Looking ahead, there's a notable trendline resistance on the upper side. If the price manages to breach this trendline and subsequently provides a retest, it may present a favorable opportunity to consider long positions.

TradingView
Looking good for swing #panama: After good breakout with volume, panama is now under consolidation and can shoot up anytime. Targets plotted. Keep sl below 300 dcb http://dlvr.it/Svt9h4 πŸ“Š Full Chart πŸ‘‰ #tradingtips #tradingeducation #stockpicks #investing #MarketWatch
Looking good for swing #panama

After good breakout with volume, panama is now under consolidation and can shoot up anytime. Targets plotted. Keep sl below 300 dcb

TradingView

$COIN found support at the 0.618 Fibonacci retracement level: NASDAQ:COIN found support at the 0.618 Fibonacci retracement level. It is currently above the VWAP but below the 50-day moving average. The 9-day moving average crossed above the 20-day moving average, which is a good sign. Oscillators are also turning up.

However, the stock price needs to cross above $90 to continue the… http://dlvr.it/Svt9Cr πŸ“Š Full Chart πŸ‘‰ #tradingcommunity #StockNews #tradingsignals #tradingstrategy #MarketWatch

$COIN found support at the 0.618 Fibonacci retracement level for NASDAQ:COIN by PaperBozz

NASDAQ:COIN found support at the 0.618 Fibonacci retracement level. It is currently above the VWAP but below the 50-day moving average. The 9-day moving average crossed above the 20-day moving average, which is a good sign. Oscillators are also turning up. However, the stock price needs to cross above $90 to continue the bullish trend. Breaking below $72 would be bearish and could see it go down to the $61-$62 area. The price movement of Bitcoin and the SEC's decision on a Bitcoin ETF will …

TradingView

Gujarat Gas: Looks good for a reversal as a bullishbdivergene has been spotted on a weekly time frame

As the sectoral rotation is being shifted to (Energy and Oil&Gas), GujGas can be one of the good bets.

For a safe entry, above 480 is the entry and for the aggresive ones, CMP is the best level. http://dlvr.it/Svt900 πŸ“Š Full Chart πŸ‘‰ #stockpicks #stocks #MarketWatch #tradingeducation #DayTrading

Gujarat Gas

Looks good for a reversal as a bullishbdivergene has been spotted on a weekly time frame As the sectoral rotation is being shifted to (Energy and Oil&Gas), GujGas can be one of the good bets. For a safe entry, above 480 is the entry and for the aggresive ones, CMP is the best level.

TradingView
amazon in days: We notice that the market has reached the resistance price, and we are in the month of September. I think the Amazon index has declined http://dlvr.it/Svt39s πŸ“Š Full Chart πŸ‘‰ #tradingcommunity #StockScreener #stockalerts #stockpicks #fintech
amazon in days

[b]We notice that the market has reached the resistance price, and we are in the month of September. I think the Amazon index has declined [/b]

TradingView
Anglogold on Verge of Breakout: Anglogold is in a falling wedge and we see price ready to breakout to the upside in the process confirming a weekly low price at R299.07. If we close above the green resistance, we want price to remain above the pink support in a move higher. This will guarantee a cycle where we will break that support onto a daily cycle low later in October ensuring we… http://dlvr.it/Svt39K πŸ“Š Full Chart πŸ‘‰ #stockcharts #stockanalysis #SwingTrading #investing #tradingstrategy
Anglogold on Verge of Breakout

Anglogold is in a falling wedge and we see price ready to breakout to the upside in the process confirming a weekly low price at R299.07. If we close above the green resistance, we want price to remain above the pink support in a move higher. This will guarantee a cycle where we will break that support onto a daily cycle low later in October ensuring we have a low probability of a failed cycle (i.e. lower than R299.07, which is also the stop-loss). It is critical that we do not go lower than 23 February price, the previous weekly low, if we do then price will be in yearly decline.

TradingView
S Stock Ready to in the Perfect Buy Zone!: On my graph I created a golden zone to enter and the price did drop till their! And now it shoulded some bullish candles. I entered the trade with my stop loss and the take porfit at the end of green zone. http://dlvr.it/SvsxWZ πŸ“Š Full Chart πŸ‘‰ #wallstreet #StockNews #tradingtips #tradingeducation #stockpicks
S Stock Ready to in the Perfect Buy Zone!

On my graph I created a golden zone to enter and the price did drop till their! And now it shoulded some bullish candles. I entered the trade with my stop loss and the take porfit at the end of green zone.

TradingView