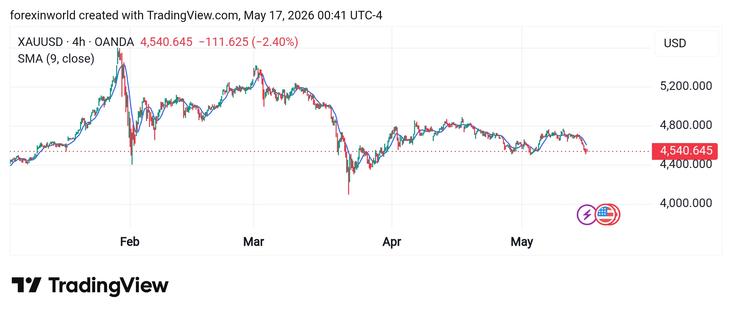
The RSI meter shows these stocks in oversold zone.
Stocks with RSI below 30:
1. NKE - RSI: 18.4
2. PODD - RSI: 25.3
3. SJM - RSI: 27.3
What do the charts tell you? Sound off!
📝 Alternate Bat Harmonic Pattern Indicator on TradingView - Free - [TradingFinder]
🔎 The Alternate Bat Harmonic Pattern Indicator by TradingFinder is designed to identify a specific five-point price structure and highlight areas where the market may reverse.
🌐 Now available on TradingFinder’s official website:
https://tradingfinder.com/products/indicators/tradingview/alternate-bat-harmonic-pattern/
#tflab #tradingfinder #Forex #Crypto #HarmonicTrading #TradingViewTips #PriceActionStrategy #StockMarketAnalysis #TechnicalAnalysis #TradingTools #BatPattern
The RSI meter shows these stocks in overbought zone.
Top stocks with RSI above 70:
1. VRSN - RSI: 79.4
2. IDXX - RSI: 77.6
3. ETR - RSI: 74.1
Are you watching any of these? Let us know!
Concluding Thought
This method lets you trade with confidence in a trending market while limiting the impact of manipulation attempts. #MarginControlStrategy #TradingEducation #TradingTips #LearnTrading #ETF
#MarginControlStrategy #ETF #LeverageManagement #RiskManagement #TradingPsychology #TechnicalAnalysis #TradingCommunity #TradersLife #TradingSuccess #ConsistentProfits (5/5)
Concluding Thought: This method turns valuation into a practical entry trigger even when markets move sideways. #TradingEducation #TradingTips #LearnTrading #ValueInvesting #BondTrading
#TechnicalAnalysis #SwingTrading #MarketPsychology #RiskManagement #TradingStrategy #ChartPattern #TraderCommunity #InvestingClub #ProfitGoals #ConsistentGain (5/5)