Definitely two Hoggies! 🦔🦔 Younger hedgehog enjoying some fresh water, moves away when the larger hedgehog arrives for a drink too... wonderful to see them close up and together, albeit the smaller of the two a little concerned that the larger hedgehog has tipped over the water bowl. Go Hoggies!
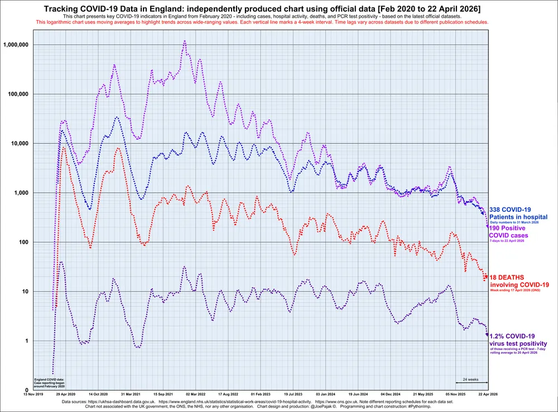
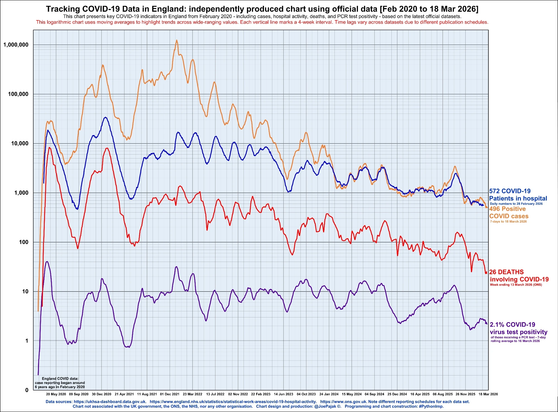
England’s COVID data from 2020–26 show the virus is still circulating — still causing infections, hospitalisations, and still taking lives. Chart using official data (UKHSA, NHS England, ONS).
What’s changed isn’t the potential impact, but the lack of any real attention.
Not forgetting Long COVID.
Independently produced chart tracking England’s COVID data from the start of official reporting (see UKHSA dashboard).
The virus is still circulating, still causing infections, hospitalisations, and Long COVID — and still taking lives.
What’s changed isn’t the potential impact, but the attention.
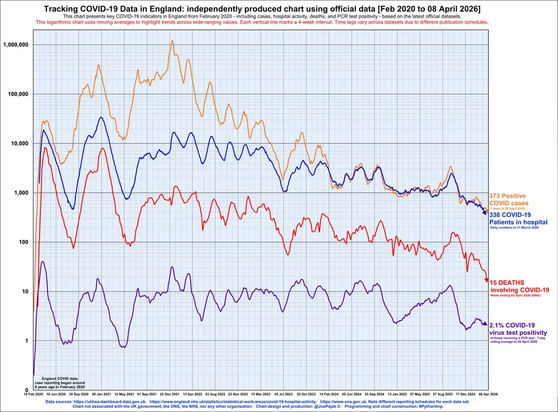
England’s latest COVID data tell a story we’re barely hearing anymore.
• 373 cases
• 338 in hospital
• 15 deaths
• 2.1% positivity
The virus is still circulating, still causing infections, hospitalisations, Long COVID — and still taking lives.
What’s changed isn’t the risk, but the attention.
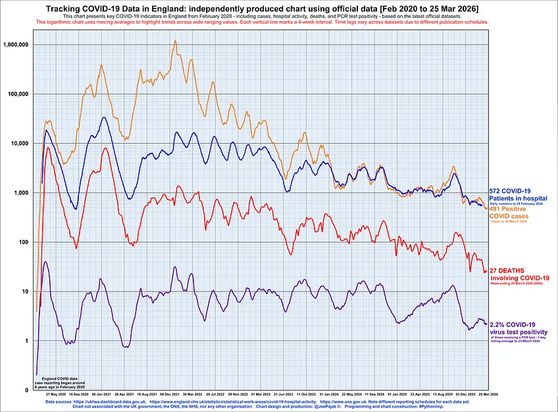
England COVID-19 update
• 491 weekly cases (to 25 Mar 2026)
• 27 deaths involving COVID-19 (w/e 20 Mar 2026)
• 525 hospital admissions (to 28 Feb 2026)
• 2.2% PCR test positivity (to 23 Mar 2026)
Data source
@ukhsa.bsky.social
dashboard
#COVID19 #England #UKHSA #COVIDData #PublicHealth #EpidemiologyEngland’s latest COVID data tell a story we’re barely hearing anymore.
Official reports show the virus is still circulating, still causing infections, hospitalisations, Long COVID, and tragically deaths, even if media coverage has all but vanished. England’s latest COVID data tell a story we’re barely hearing anymore.
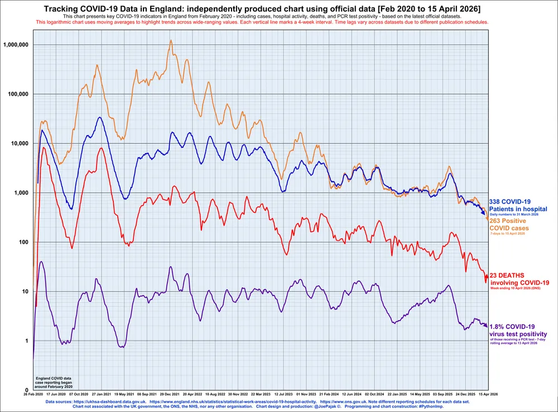
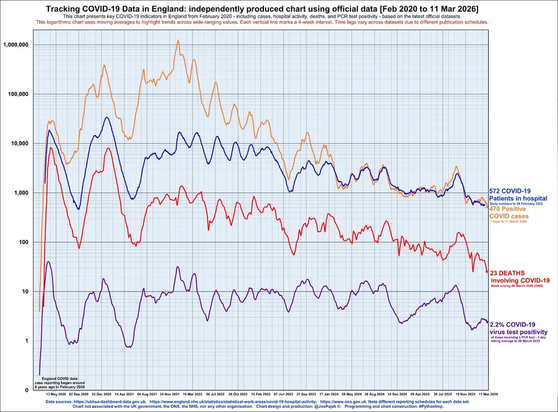
A logarithmic line chart showing COVID‑19 trends in England from early 2020 to 11 March 2026.
Four indicators are plotted using moving averages: positive cases (orange), COVID‑19 patients in hospital (blue), deaths involving COVID‑19 (red), and PCR test positivity (purple).
The chart highlights that although reported activity has fallen dramatically from peak waves, COVID‑19 continues to circulate at a steady, low level.
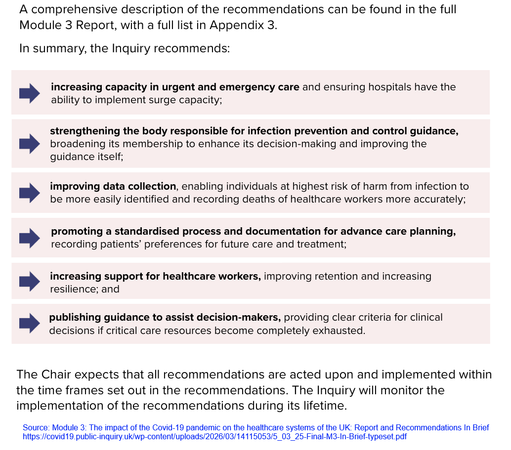
Module 3: 'The impact of the Covid-19 pandemic on the healthcare systems of the UK. Recommendations:'
Source: @ukcovid-19inquiry.bsky.social 19 Mar 2026
'The Chair expects that all are acted upon & implemented within the time frames set out in the recommendations'.
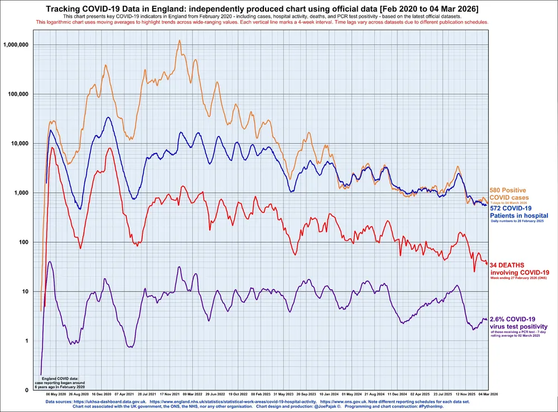
https://covid19.public-inquiry.uk/reportsLatest England COVID‑19 data - plotted on a chart showing weekly: cases, hospitalisations, deaths, and PCR positivity.
👉 580 cases, 572 in hospital, 34 deaths, 2.6% positivity.
Reminding us that COVID hasn’t gone away.
Sources:
#UKHSA,
#NHSEngland,
#ONS.
A logarithmic line chart shows COVID‑19 trends in England from early 2020 to February 2026. Four lines track positive cases, hospital patients, deaths involving COVID‑19, and PCR test positivity. All indicators rise and fall in multiple waves. The most recent data shows around 611 cases, 617 hospital patients, 43 weekly deaths, and 2.7% PCR positivity. The chart uses official UKHSA, NHS England, and ONS data.