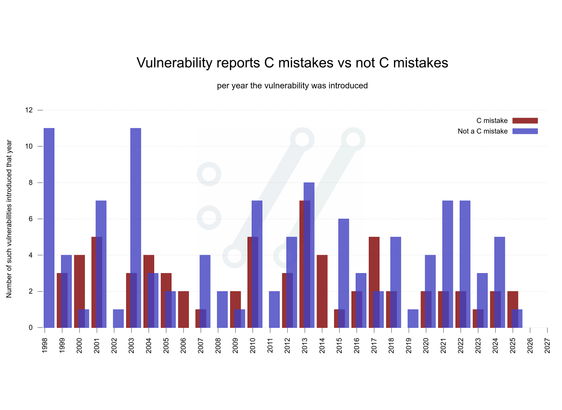
It's Friday so maybe try out a new #curl graph? A variation of the classic vulnerability reports C mistakes vs not C mistakes, but with bars per year.
It's Friday so maybe try out a new #curl graph? A variation of the classic vulnerability reports C mistakes vs not C mistakes, but with bars per year.