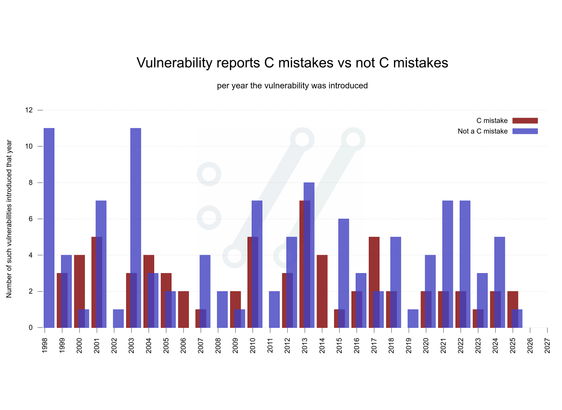
It's Friday so maybe try out a new #curl graph? A variation of the classic vulnerability reports C mistakes vs not C mistakes, but with bars per year.
@bagder it would be interesting to see the same graph but by year the vulnerability was introduced
@ilmari hang on...
@bagder I'm assuming that because the nature of the data represented in the graphs (which would suggest an investigation if not a fix), all the vulnerabilities accounted for are from valid reports?
Given the age of curl and how widely available it is (for instance, I'm using it on a daily basis), it is impressive that the numbers are so low.
Does the surge in the first graph correspond to the introduction of the bug bounty program?
@huronbikes In 2016 we had our first code audit that coincided with people really starting to scrutinize it. Presumably because people realized it was widespread. The bounty started in 2019.