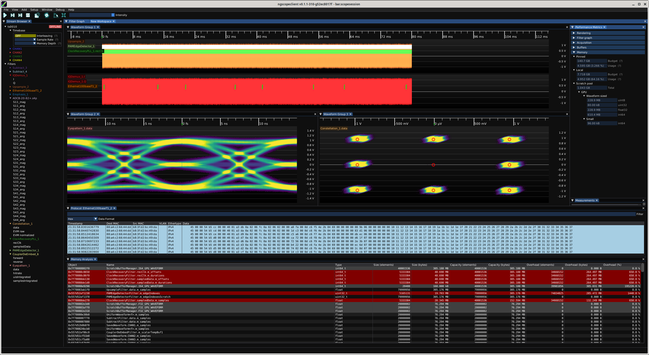
As part of the ongoing effort to reduce VRAM bloat in ngscopeclient I've added some nice debug tools (currently accessible by Window | Memory Analysis but that will probably get moved to the debug menu at some point) to show you the full list of AcceleratorBuffer objects along with a bunch of metadata.
Haven't figured out how to right align the column titles but this is a debug visualization so not a huge priority.
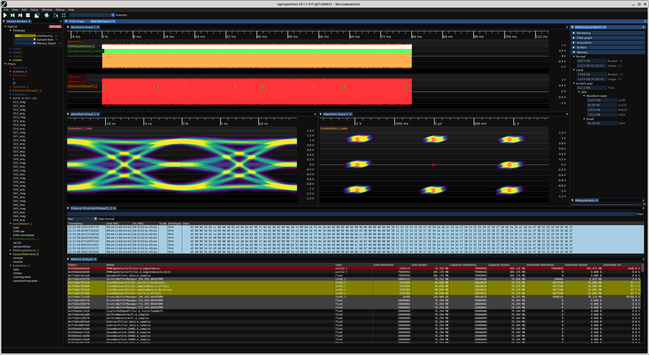
Rows with more than 10% overhead (capacity > 1.1*size) are color coded yellow, and more than 100% red. This lets you quickly zero in on buffers that are much larger than the data they're holding.
You can see the CDR PLL buffers have huge overhead, with ~40 MB of used data in a 305 MB allocation. One of the scratch buffers is 305 MB and only using 160 kB.
This is an unfortunate necessity of parallel filters, you have to allocate a buffer big enough for the largest possible output since you don't know the actual number of packets/clock edges until the shader runs.
One thing I'm considering for the worst offenders is to switch to an iterative algorithm: allocate say 1/16 of the theoretical maximum output size to start, and have the shader return an error if the buffer is too small. Then iteratively double the output buffer allocation until there's enough space.
This will result in an extra O(log N) allocations and shader executions the first time the shader runs but assuming the data is pretty consistent, should be O(1) after startup and save a lot of VRAM.