Source-Level Debugging of Compiler-Optimised Code: Ill-Posed, but Not Impossible, https://dl.acm.org/doi/10.1145/3689492.3690047. There's almost no research in this area so it's good to see someone thinking about some of the challenges. I'd like to have seen a discussion of undefined behavior, specifically, since there's a paradox where C programmers are most likely to use debuggers exactly in cases where UB is present, which poses fundamental challenges to source-level debugging.
I do think there is a potential resolution but it requires the parallel source-level simulation to have a complete runtime UB detector along the lines of Rust's Miri, which involves a level of simulation overhead orders of magnitude beyond what you'd normally expect (or accept) for deoptimized code/source-level simulation. Speaking of Miri, there's a forthcoming POPL paper: https://plf.inf.ethz.ch/research/popl26-miri.html

And I don't see how you could do the paper's proposed attach-on-demand simulation (to avoid having to simulate from the beginning of execution to catch up) for something like UB detection since you need to potentially know the complete pointer provenance of every pointer in the program state if you want to do UB detection.
There's also well-known issues with record-and-replay-like approaches for dealing with fine-grained thread race non-determinism. Existing systems like rr generally take control of scheduling and run everything serialized, so even with zero administrative overhead you'd still suffer an upfront slowdown (before attaching the debugger) proportional to the loss of parallelism from running your program on one core. Microsoft's recorder takes a different approach but has other trade-offs.
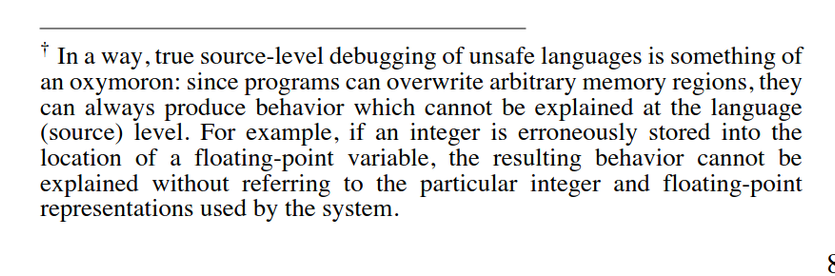
By the way, this is actually mentioned in a footnote in the original 1992 paper on deoptimization. Although the situation with UB is much worse (in terms of the breakdown of source-level semantics) than their example here suggests.
@smarr Thanks! Yes, more stuff to appear (preprint of our new OOPSLA paper coming soon)!
@pervognsen Yes. Nice observation! It's true that UB is by definition a departure from source semantics, and can be witnessed at debug time. We have thought a bit about using source-level executable semantics for testing and synthesis of debug info, but I think you've made a case for also using them at debug time to flag the effects of executing through UB. That would be neat! I will think.
cc @jryans
@pervognsen When writing C/C++, I mostly find myself using a debugger when things go wrong and I'm likely in UB territory. At this point, I'm mostly looking at the disassembly and all of the source/variable mapping of the debugger is a mere convenience, and it's understandable why some things don't work.
When I see people (mostly from or inspired by the Windows gamedev world) talk about continuous usage of debuggers, I do wonder a bit what they're doing with it. Is it a nice interface for getting traces of execution? Do they just want to set a breakpoint in a function for an input doing something they don't understand then step through it until they do understand? Do they actually want to execute newly compiled code from the debugger like a REPL?
@zwarich @pervognsen In my experience, it’s mostly to test a hypothesis. Games have mountains of hidden state and extremely branch-heavy logic, and engines only sometimes invest in in-process inspection or tracing. So the hypothesis-reproduce-check loop can be the local maxima for exploring the configuration space.
@jc @pervognsen In a low-level language, it's not really possible for the toolchain to provide a uniform tracing solution (because there's no runtime to manage the trace buffer).
However, operating systems provide debugger interfaces, which allow external programs to interpose at the userspace/kernel boundary, which barring the use of binary instrumentation (the other solution @pervognsen mentioned with a different set of tradeoffs) is the only way to provide universal tracing. Or at least almost universal tracing, because ptrace() and friends have all sorts of bugs/quirks that prevent them from working completely reliable, but you're unlikely to create an alternative with higher reliability for uncooperative programs.
This would be my main use for debugging (rather than e.g. actually executing new code with side effects in a debugger context), so given a slightly greener field perhaps it would be better to target this directly?
@zwarich @pervognsen Yes to all your second paragraph. I have a mental model of what my code is doing. But except for trivial code I am not confident in this model until I test it against reality.
@zwarich @pervognsen all of the above? although executing new code is more the wheelhouse of live++ these days. there's no reason to run without a debugger, and most issues are pretty trivial to diagnose when you can inspect up and down the callstack. i believe Per is a big "run to cursor" enjoyer as well, which is like a lite version of live++ if your build time / launch process enables. personally i often end up with a series of breakpoints i manually toggle on and off to trace execution.
@zwarich @pervognsen I would also add that it's not necessarily a *nice* interface for getting traces, at least visual studio can be kind of a big pita. but it's the least invasive version when you don't want to paste 500 tracepoints in your code and then manually filter through a log file. (i do that a lot too, but it's generally nice to avoid if possible) sometimes i also use profiling tools as a live inspectable log as well, since you can usually record arbitrary values into the trace.
@pervognsen There was a talk by the visual studio team at cppcon about their cool new thing in that area: compile everything twice, optimized and unoptimized and switch to the unoptimized version when a breakpoint is hit.
@foonathan
Sounds like sth with a high potential to make bugs disappear when you're watching them with a debugger.
Also, does that mean they do JIT-like safepoints - points in the optimized programs where all variables exist in well-defined locations?
@pervognsen
@wolf480pl @foonathan Reading between the lines of their announcement blog post at https://devblogs.microsoft.com/cppblog/cpp-dynamic-debugging-full-debuggability-for-optimized-builds/, I think it's done at function entry, so it's not like traditional deoptimization where it can happen at the finer granularity on control back-edges inside loops or whatever.

C++ Dynamic Debugging: Full Debuggability for Optimized Builds - C++ Team Blog
Over the past 5 years, we’ve had many incredible opportunities to engage with game developers. From AAA studios to indie developers, the passion for slashing iteration times is significant. Amidst all the fantastic feedback we’ve received for Visual Studio, one sentiment has rung loud and clear: a desire to debug optimized C++ code without sacrificing […]
@foonathan @pervognsen yeah i believe that's more or less a clone of the existing feature in live++, which lets you dynamically recompile a function without optimizations, and replace it live. but it doesn't really help for post-hoc investigation since if you fault or whatever, it's already too late to interpose the debuggable version.
@pervognsen How does this compare to Cliff Click's work on Smalltalk/Self in the 90s which included debugging optimized code by constraining optimizations to the ones he knew he could 'reverse' in the debugger?
@nothings They cite and talk about the original 1992 SELF paper on deoptimization: https://bibliography.selflanguage.org/_static/dynamic-deoptimization.pdf. I think Click's work on deoptimization was for Java/HotSpot (still at Sun but later in the 90s) but I don't know that he ever worked directly on SELF? Lars Bak, later of V8 fame, does show up in the deoptimization paper in a few places, incidentally.
@pervognsen Haha, I think I conflated "Craig Chambers" and "Cliff Click" for obvious reasons.