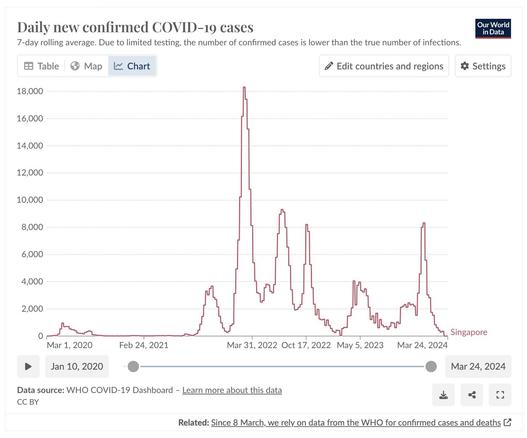
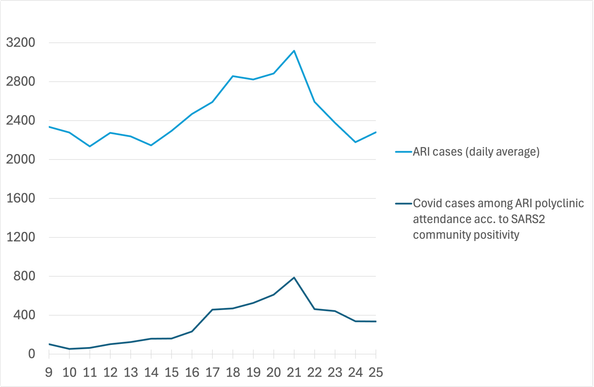
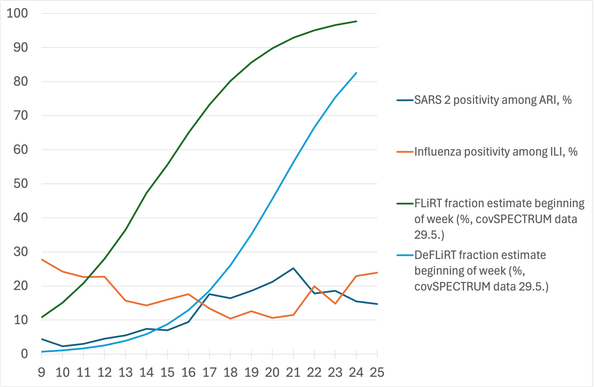
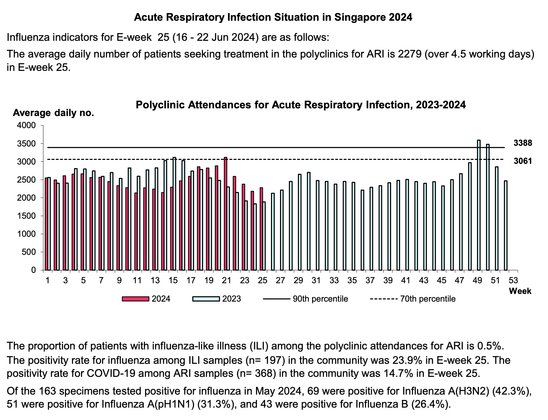
Covid wave in Singapore, update wk. 20: Highest SARS2 positivity among ARI since wk.9, 21%. I wonder if they are at peak yet.
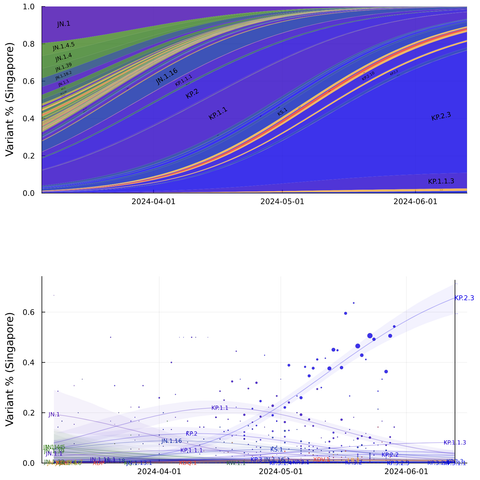
No new seqs in covSPECTRUM since April 25. FLiRT highly dominant with the last data, KP.3 <10%.
Covid wave in Singapore, update wk. 20: Highest SARS2 positivity among ARI since wk.9, 21%. I wonder if they are at peak yet.
No new seqs in covSPECTRUM since April 25. FLiRT highly dominant with the last data, KP.3 <10%.
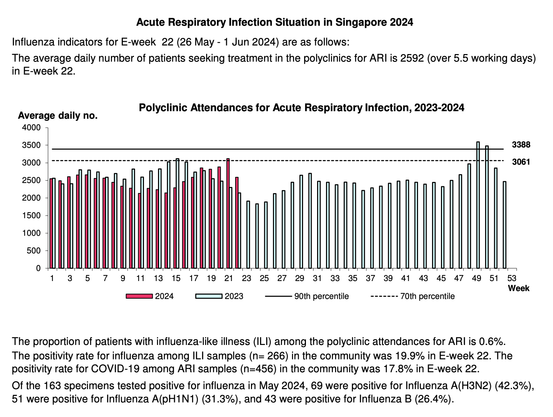
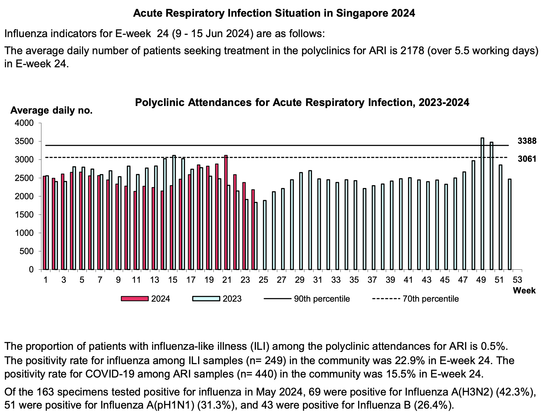
Covid wave in Singapore, update wk. 22 (wk. 21 missing): The wave might have peaked in wk. 21, ARI numbers and SARS2 positivity markedly lower.
In terms of ARI, May 2023 wave magnitude. In case numbers and hospitalisations, who knows.
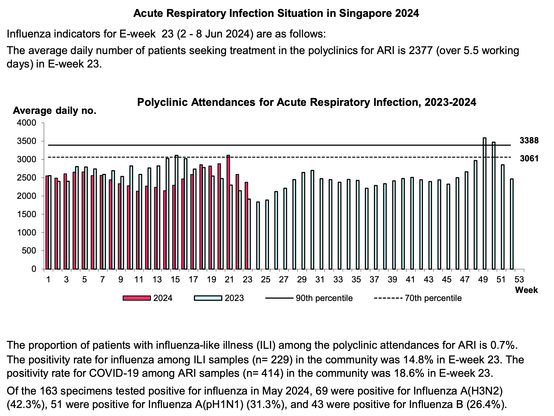
Covid wave in Singapore, update wk. 23 (wk. 21 still missing): Further reduction of ARI cases, stable SARS2 positivity.
In terms of ARI, April/May 2023 wave magnitude. Case numbers and hospitalisations: Who knows, maybe these secrets will be revealed in another press release.
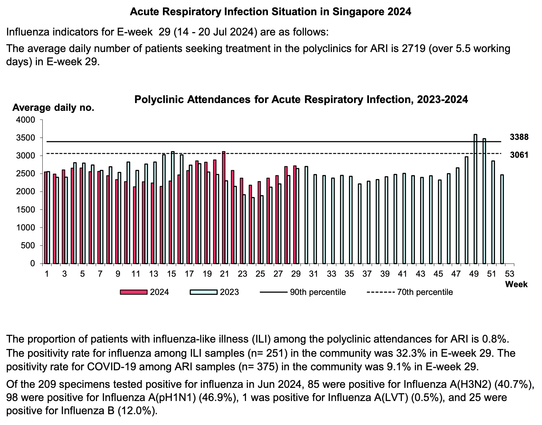
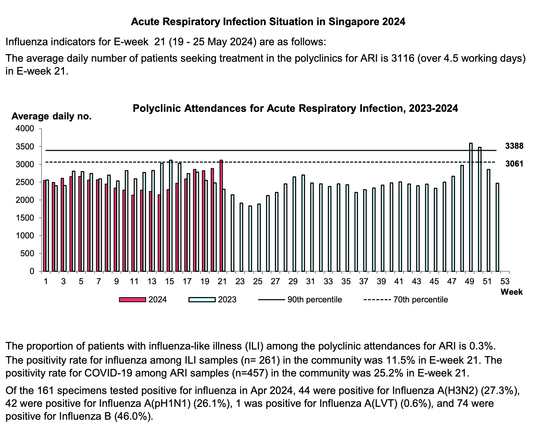
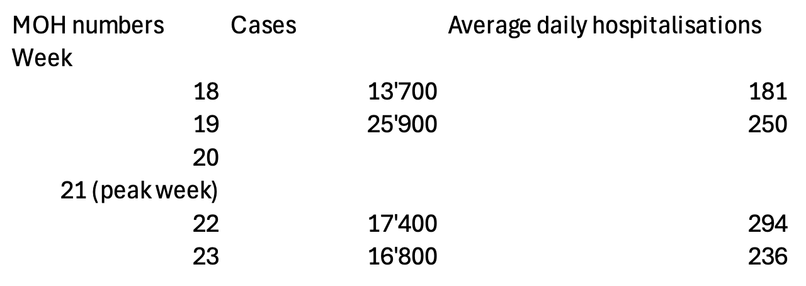
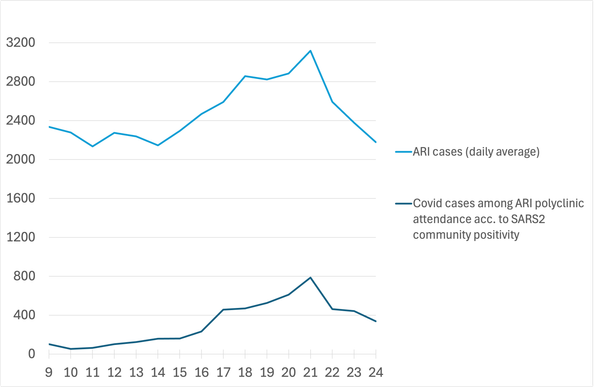
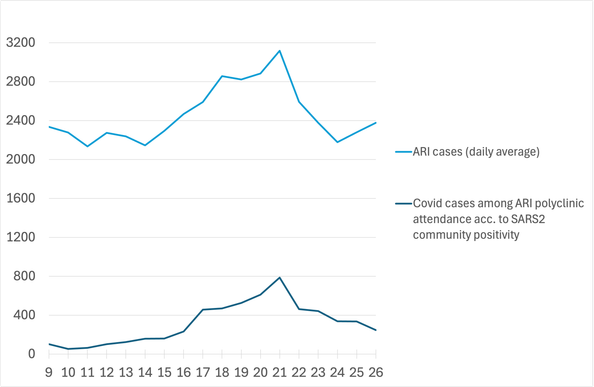
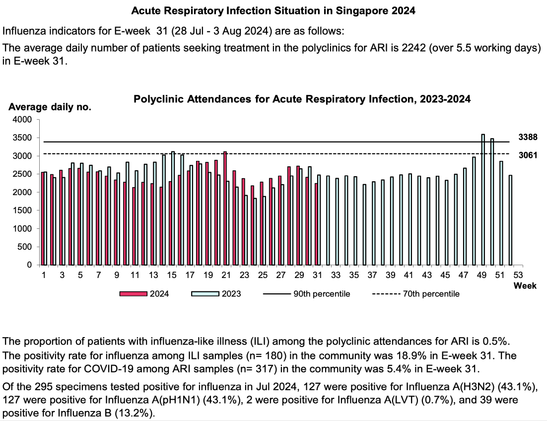
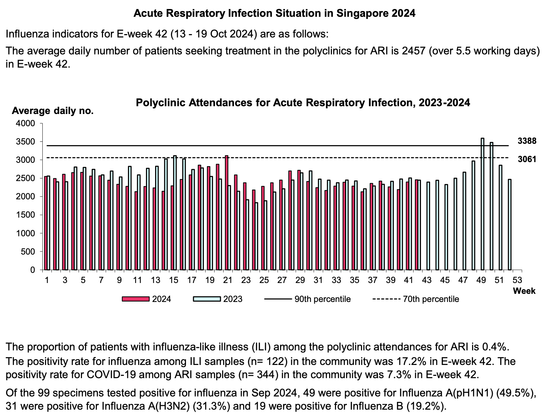
Peaked Singapore Covid wave: The MOH now supplied the missing peak week 21 ARI data and promulgated case estimates and hospitalisation data.
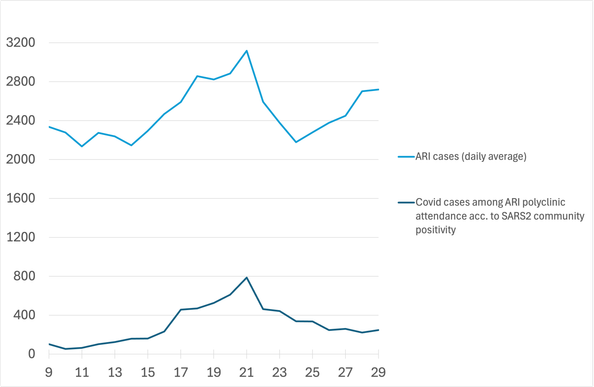
SARS2 positivity reached 25% in the peak week 21.
I could not find cases and hospitalisations for the weeks 20 and 21.


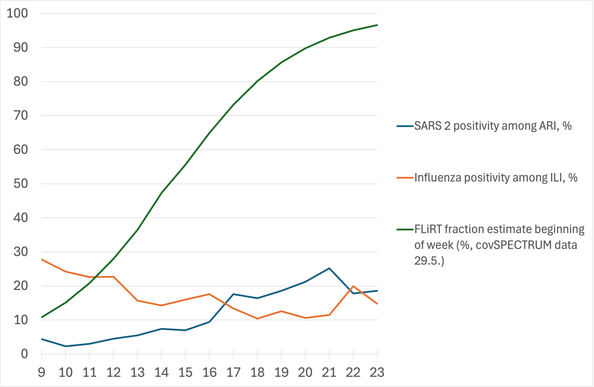
Peaked Singapore Covid wave: Update wk. 24, SARS2 positivity thankfully continued to go down. This was a FLiRT and (S:S31del + FLiRT) wave, and large. No KP.3* contribution.
KP.2.3 reached dominance around when the wave peaked in wk 21.
Sources:
https://moh.gov.sg/resources-statistics/infectious-disease-statistics/2024/weekly-infectious-diseases-bulletin
https://github.com/MurrellGroup/lineages?tab=readme-ov-file
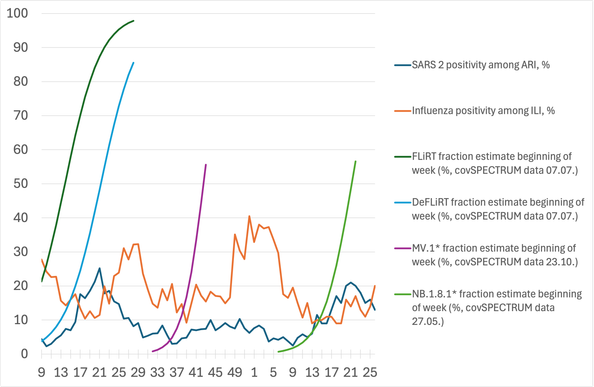
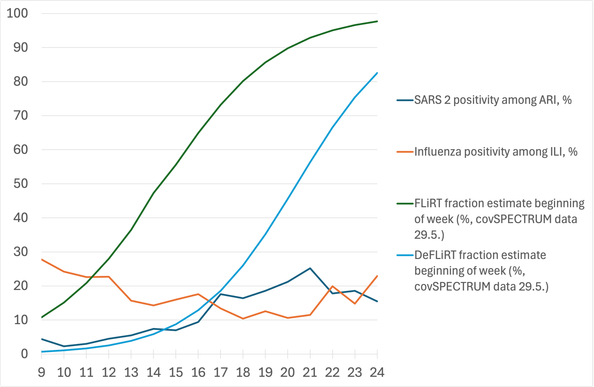
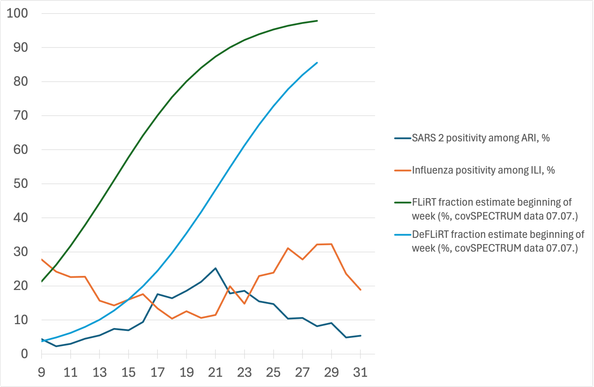
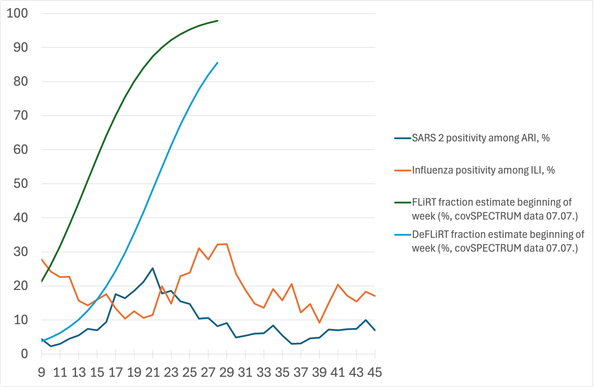
Development so far:
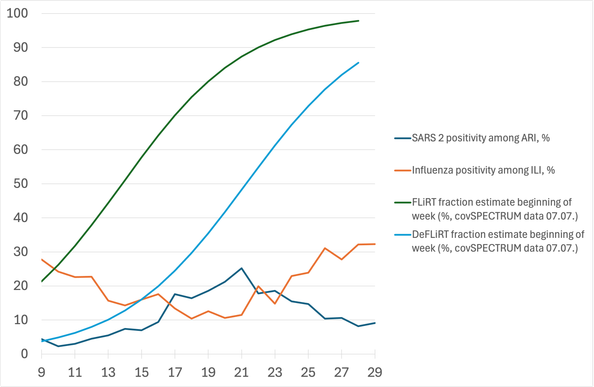
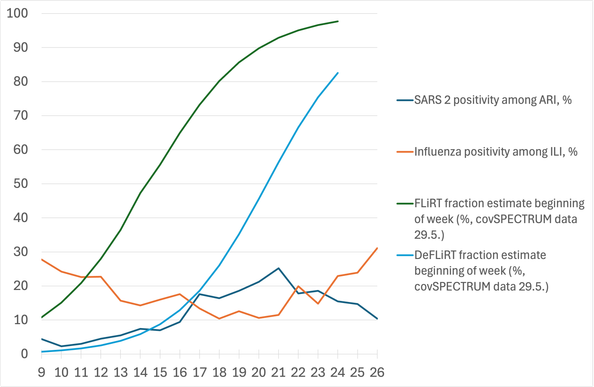
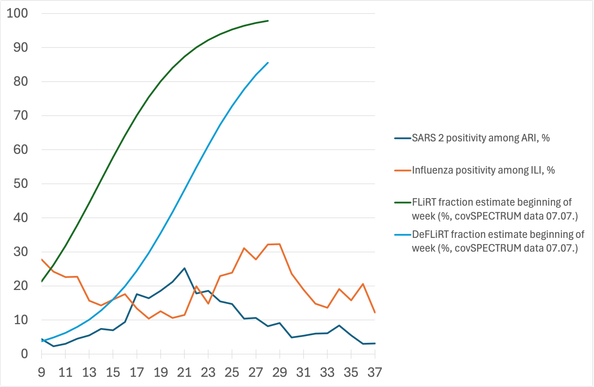
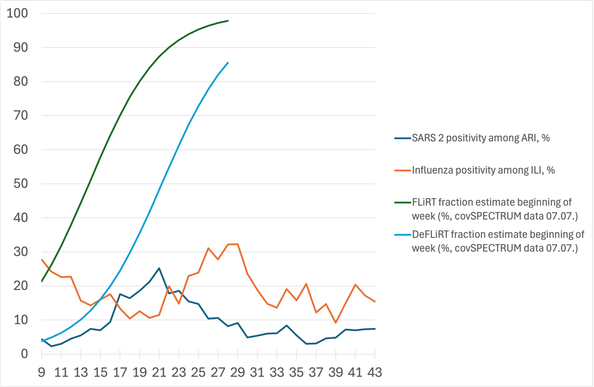
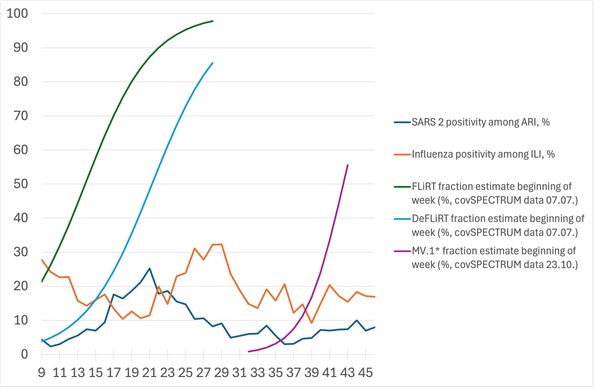
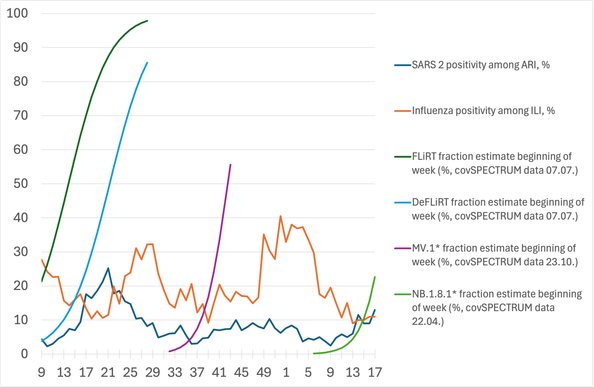
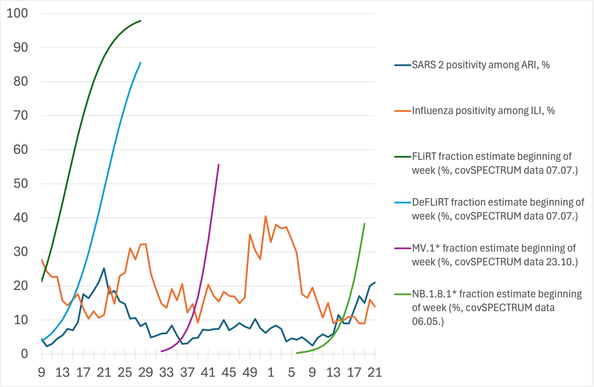
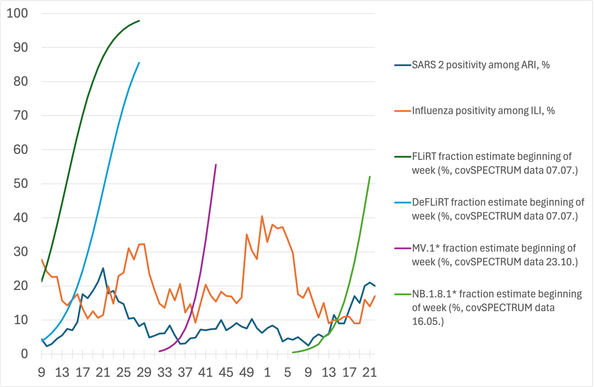
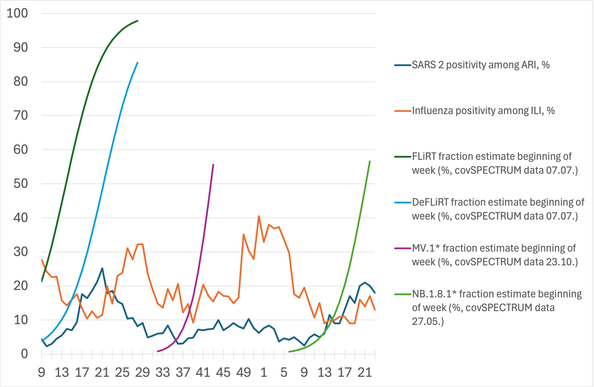
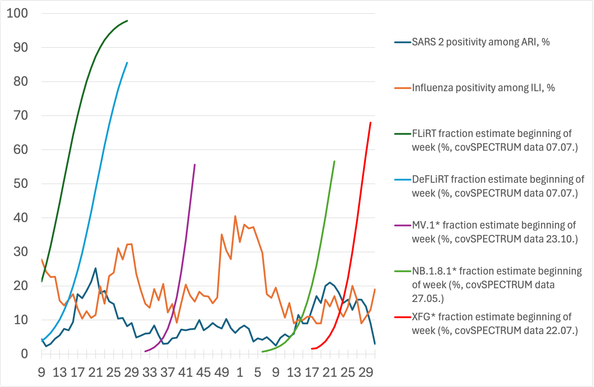
Variant fraction estimates from the covSPECTRUM tool, using Collection 42 query, last data point 29.05.
FLiRT: Multilineage JN.1 Spike with S:R346T and S:F456L
DeFLiRT: Multilineage JN.1 Spike with S:S31del, S:R346T, S:F456L
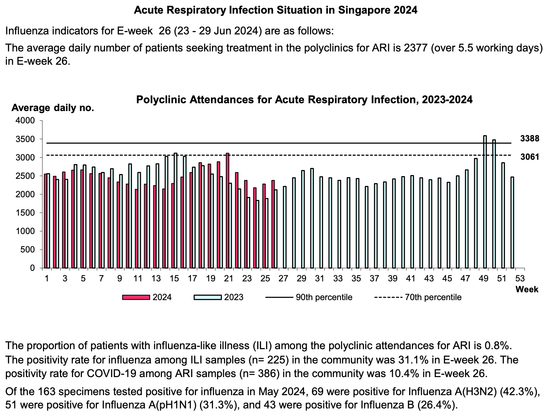
Peaked Covid wave in Singapore, update wk. 26:
Lowest SARS2 positivity among ARI since wk. 16, at the beginning of the wave.
Highest flu positivity among ILI since before wk. 9.
So rising ARI numbers are likely due to (southern hemisphere) flu, at the moment.
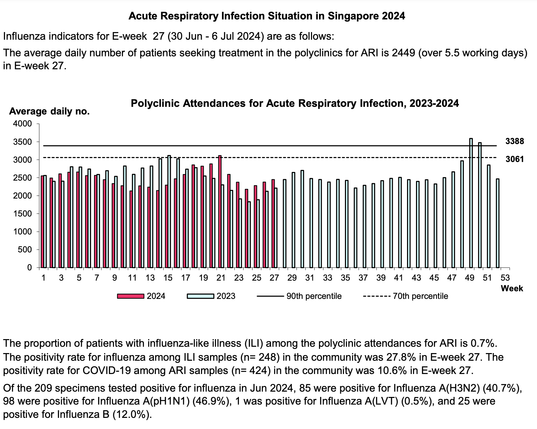
Peaked Covid wave in Singapore, update wk. 27:
Practically no change in SARS2 ARI positivities, slightly lower influenza ILI positivity.
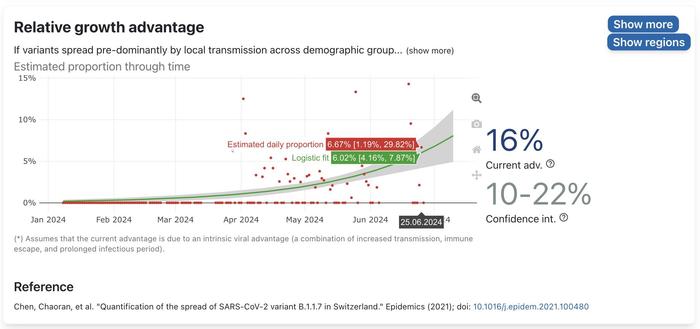
KP.3* still not much of a factor (latest data point in covSPECTRUM: 25.6.).
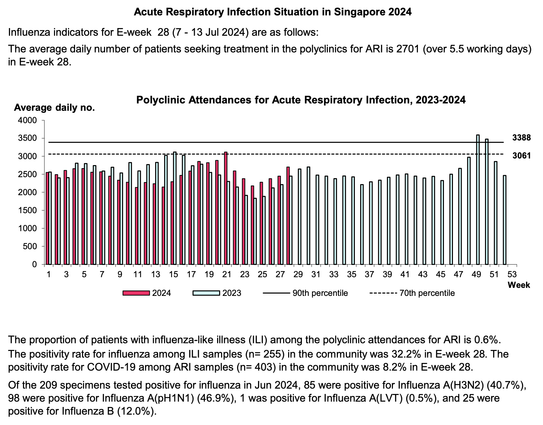
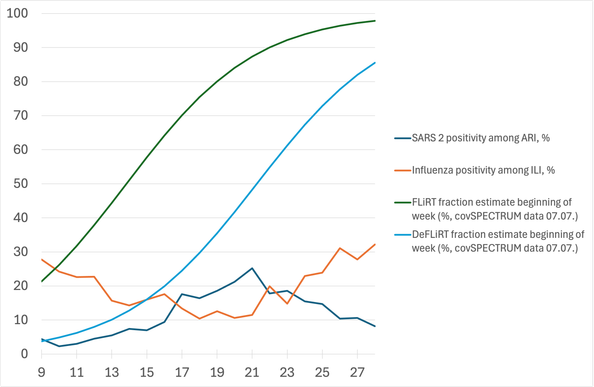
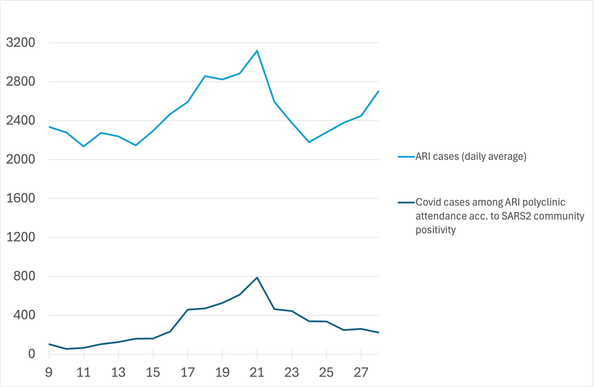
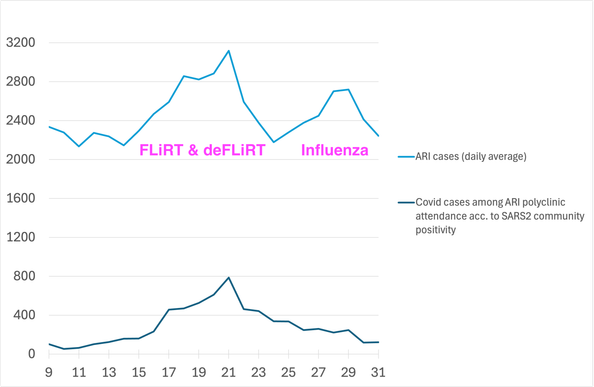
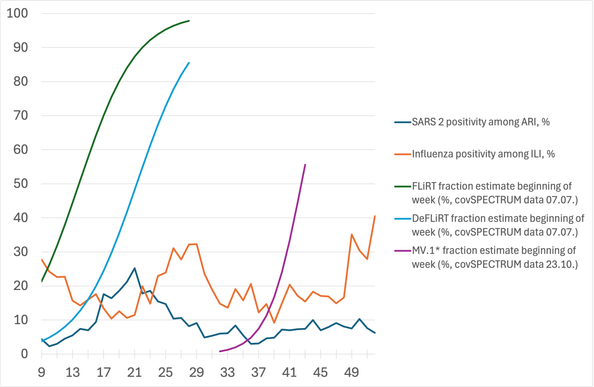
Peaked Covid wave in Singapore, update wk. 28:
Lowest SARS2 positivity among ARI since wk. 15.
Influenza positivity among ILI >30%. Rising ARI are likely due to influenza.
KP.3* still not much of a factor (latest data point in covSPECTRUM from 07.07.)
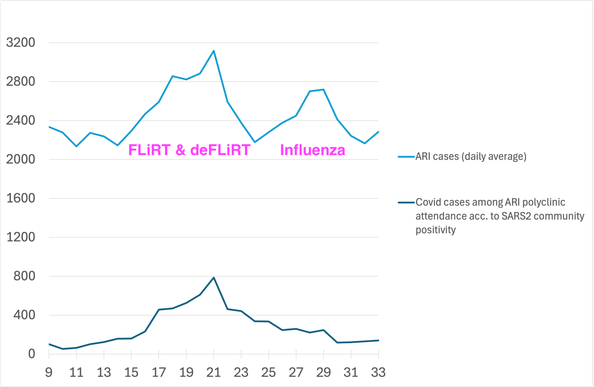
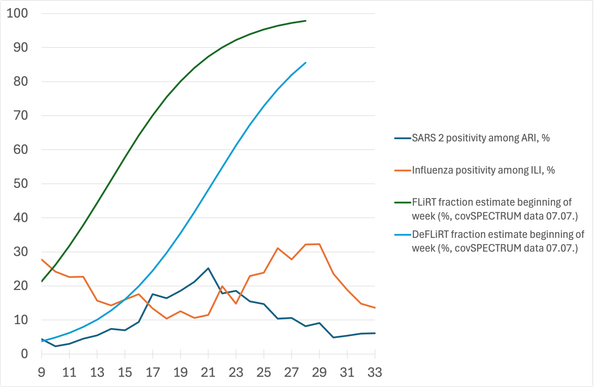
Peaked Covid wave in Singapore, update until wk. 31:
Lowest SARS2 positivities among ARI since March.
The recent influenza wave has also peaked.

Peaked Covid wave in Singapore, update until wk. 33:
These data are now at three months since the peak of the Covid wave.
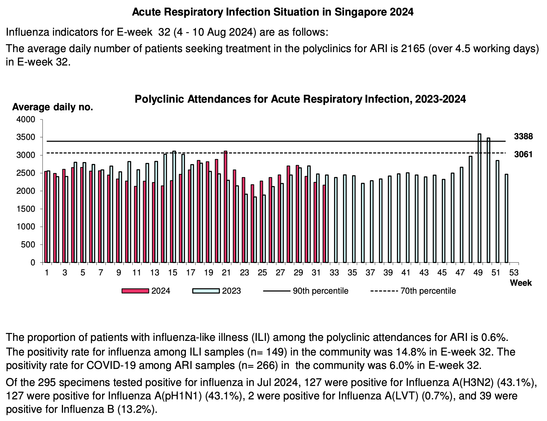
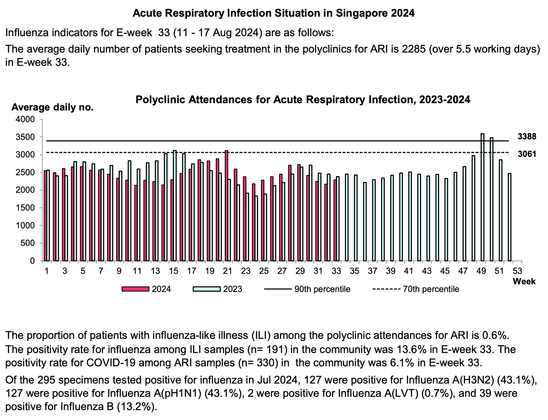
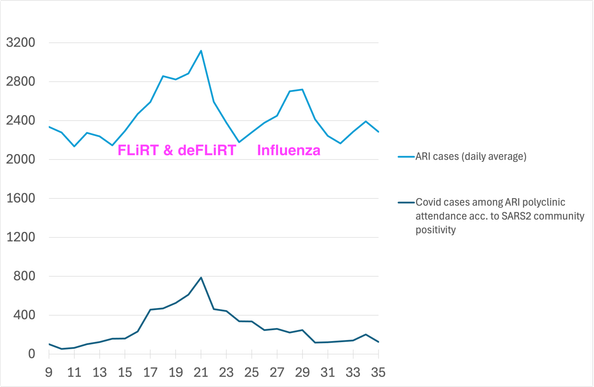
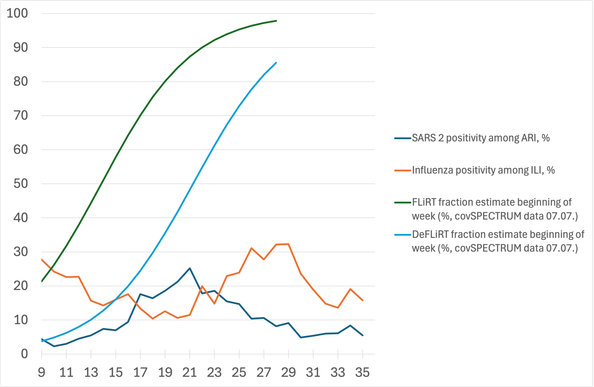
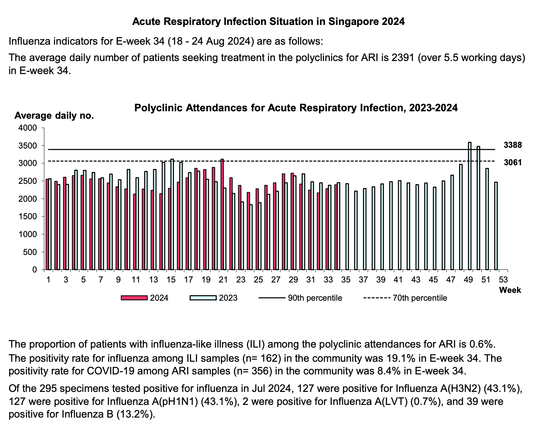
Peaked Covid wave in Singapore (wk. 21), update until wk. 35:
Still no new Covid wave, 14 weeks after the last peak. SARS2 positivity among ARI at 6%.
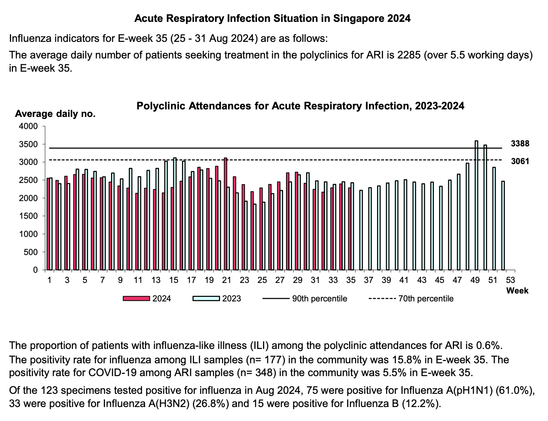
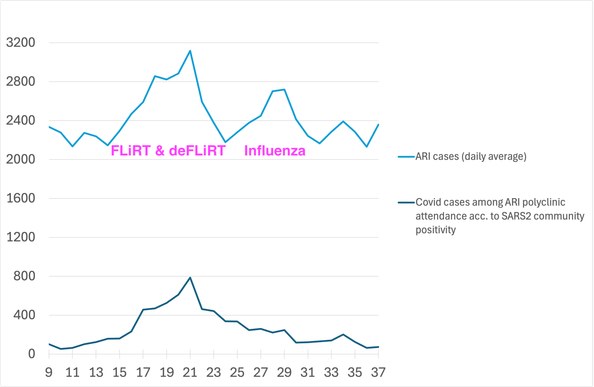
Peaked Covid wave in Singapore (wk. 21), update until wk. 37:
Still no new Covid wave, 16 weeks after the last peak.
SARS2 positivity among ARI at 3%, lowest since March.
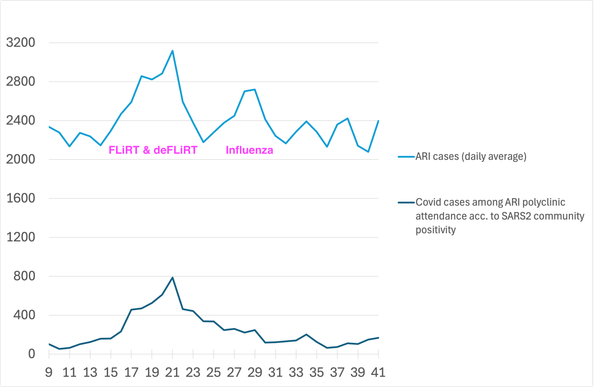
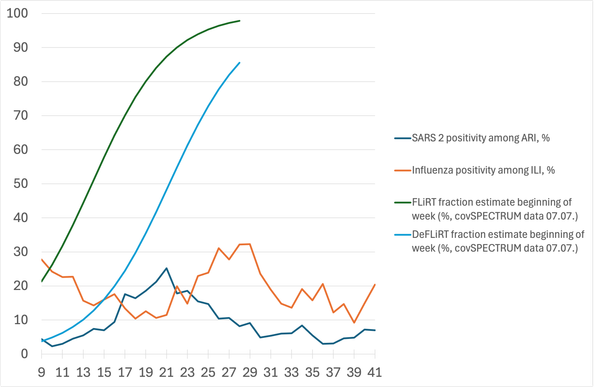
Peaked Covid wave in Singapore (wk. 21), update until wk. 41:
Still no new Covid wave, 20 weeks after the last peak.
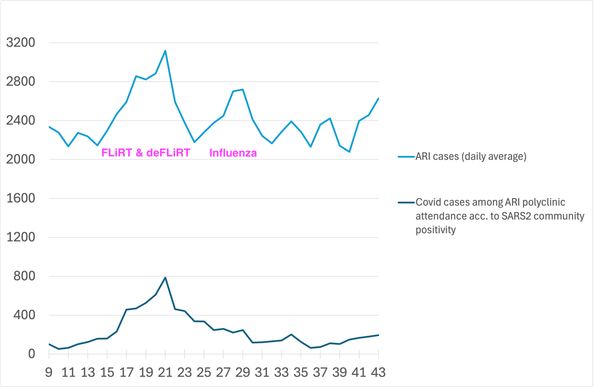
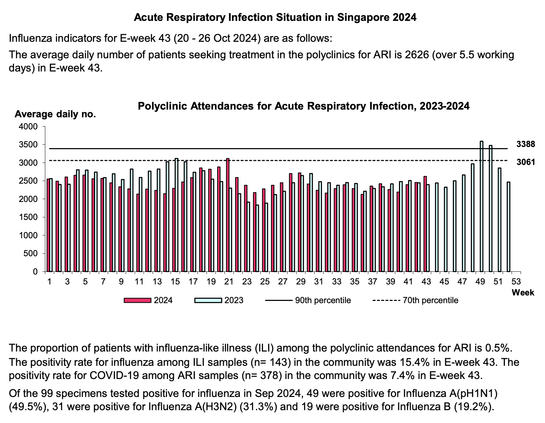
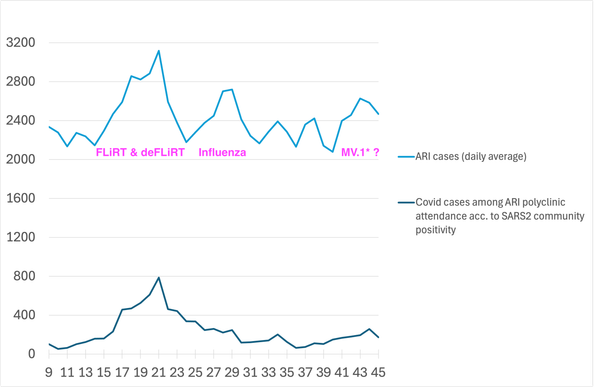
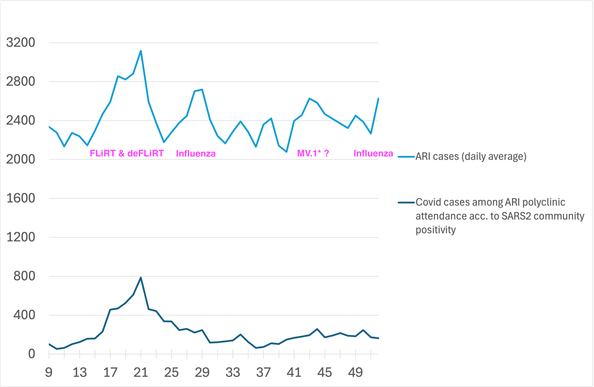
Singapore, update until wk. 43:
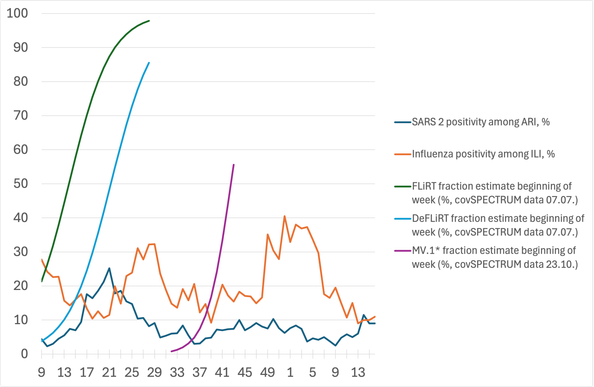
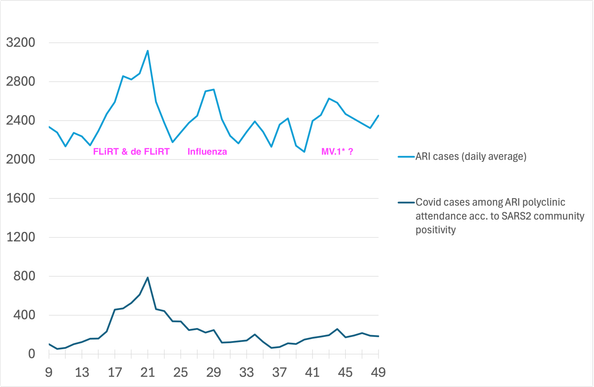
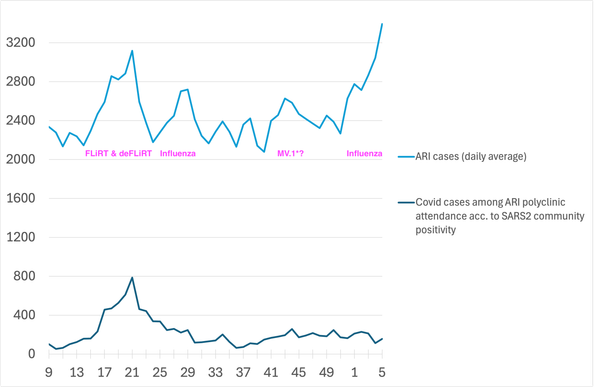
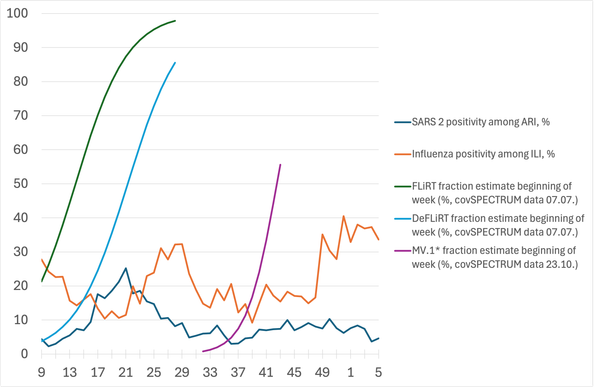
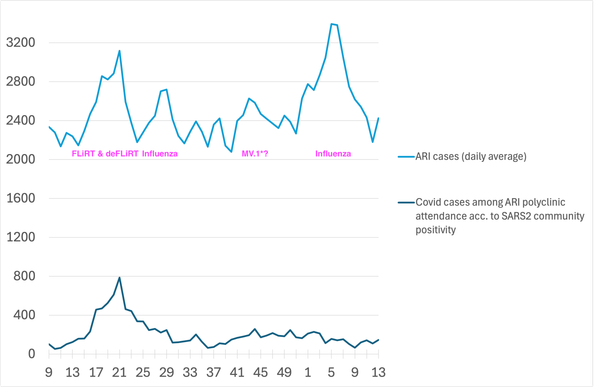
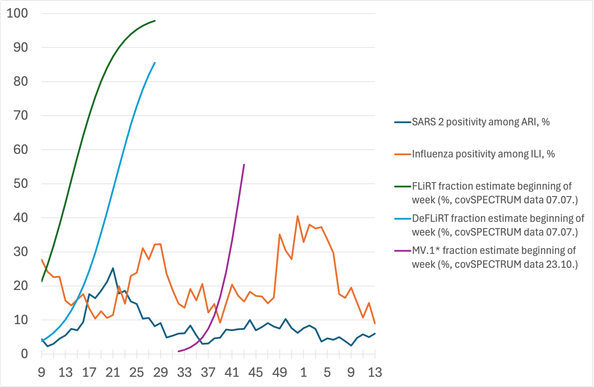
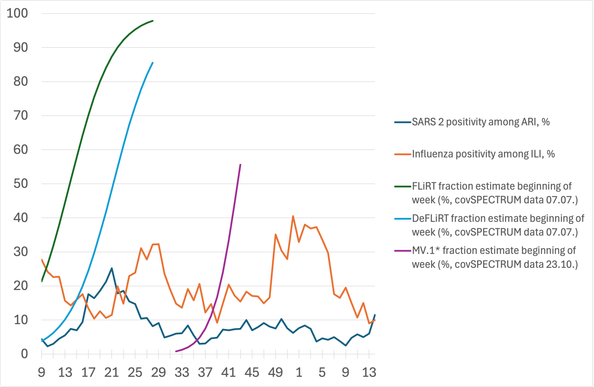
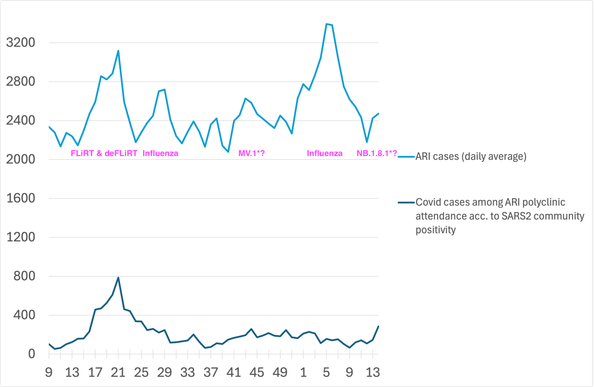
Markedly higher ARI numbers, with SARS2 ARI positivity slightly rising and flu ILI positivity falling. Pressure from MV.1*?
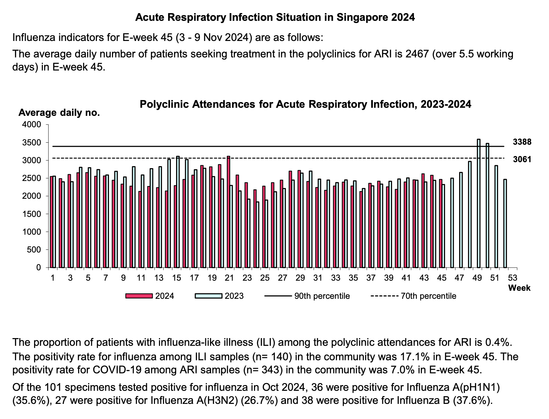
Singapore, update until wk. 45.
24 weeks after the peak of the last large Covid wave. We might see the effect of MV.1*. ARI cases and SARS2 positivity lower than in the last two weeks.
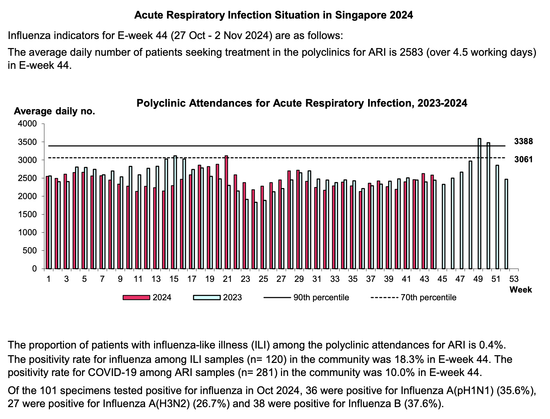
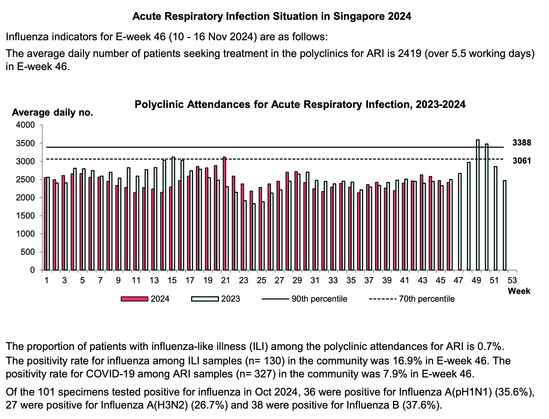
Singapore, update until wk. 46.
25 weeks after the peak of the last large Covid wave. We might see the effect of MV.1*.
MV.1* fraction estimate from covSPECTRUM (https://cov-spectrum.org/explore/Singapore/AllSamples/Past6M/variants?nextcladePangoLineage=MV.1*)

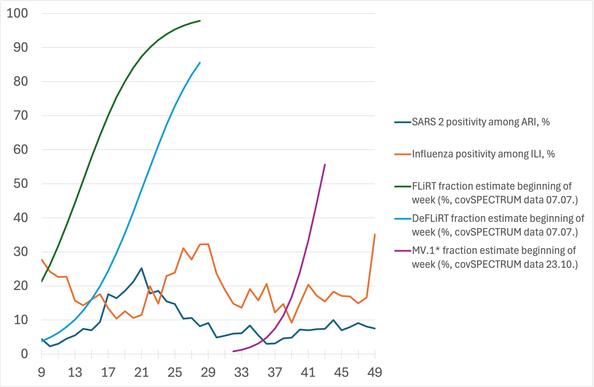
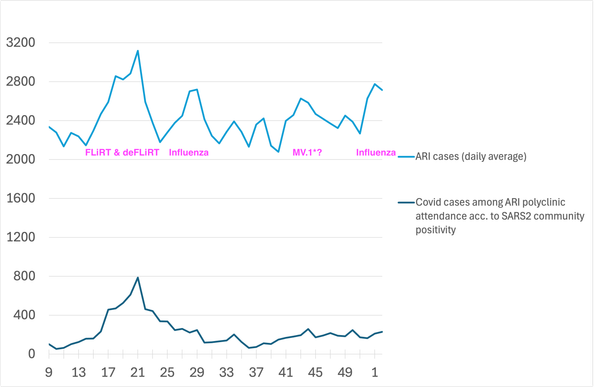
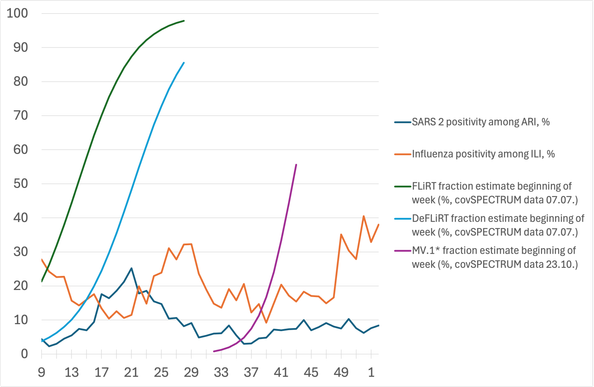
Singapore, update until wk. 49.
No Covid wave, 28 weeks after the peak of the last large Covid wave.
Wk. 49: Strong influenza positivity signal among ILI.

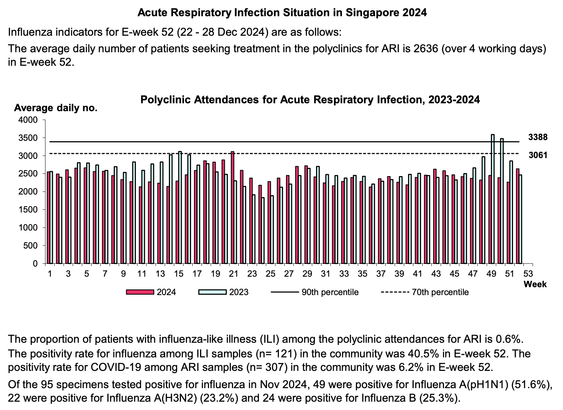
Singapore, update until wk. 52.
No Covid wave, 31 weeks after the peak of the last large Covid wave.
Influenza wave; very high influenza positivity among ILI.
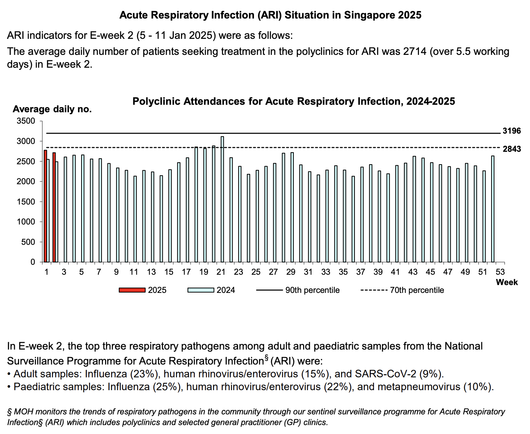
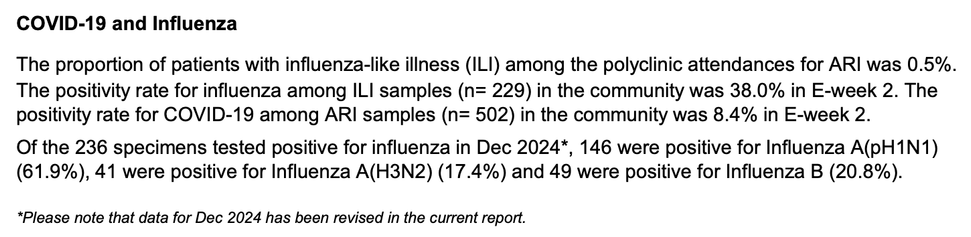
Singapore, update until week 2 2025.
No Covid wave, 33 weeks after the peak of the last large Covid wave.
Influenza wave; very high influenza positivity among ILI.
Singapore, update until week 5 2025.
No Covid wave, 36 weeks after the peak of the last large Covid wave.
Bad Influenza wave.
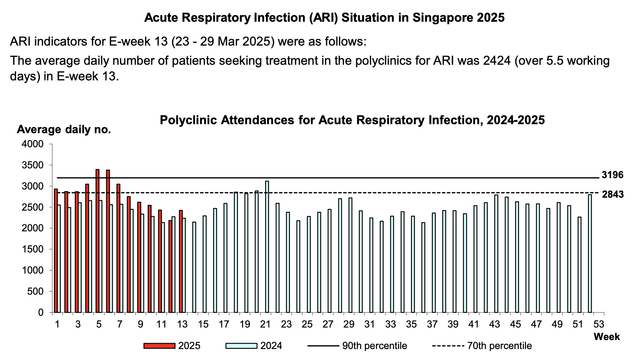
Singapore, update until week 13 2025.
The bad flu wave is over. There was no large Covid wave since almost a year.
Singapore, update until week 14 2025.
Highest SARS2 positivity among ARI since the last large Covid wave.
Might be the start of a wave. Might this be NB.1.8.1*?

Attached: 3 images #Covid A variant to watch: NB.1.8.1* It's become dominant in Hong Kong and is growing quite fast.
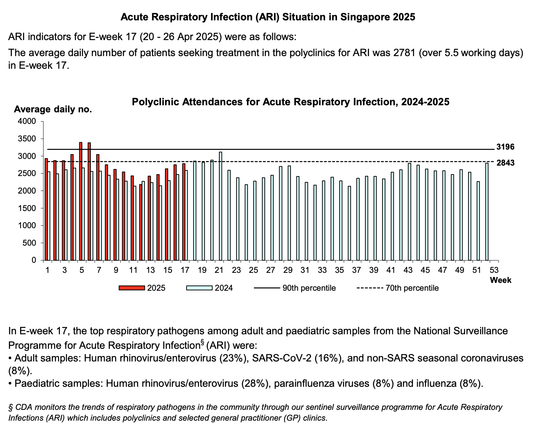
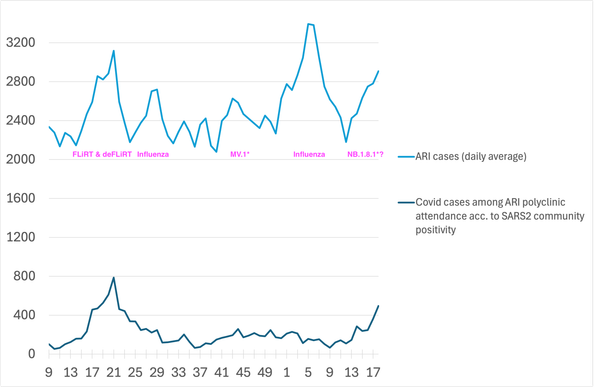
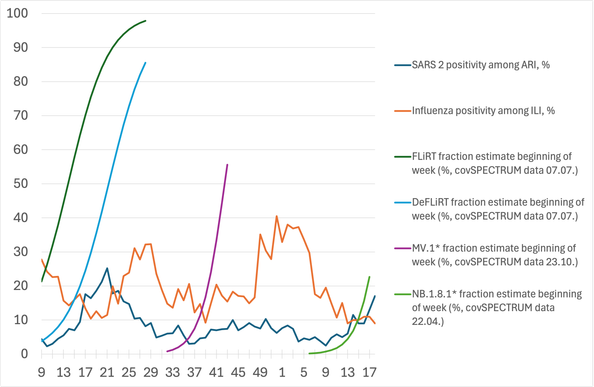
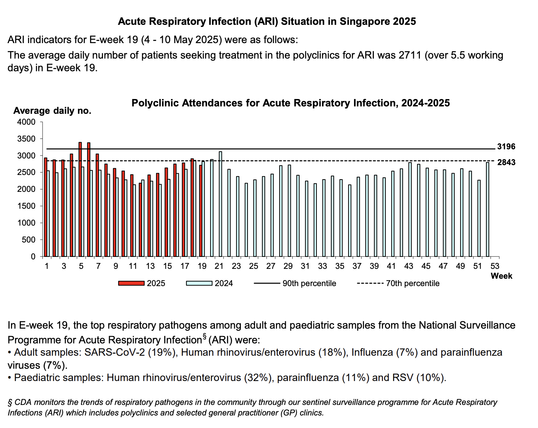
Singapore, update until week 17 2025.
Highest SARS2 positivity among ARI since the large wave last May.
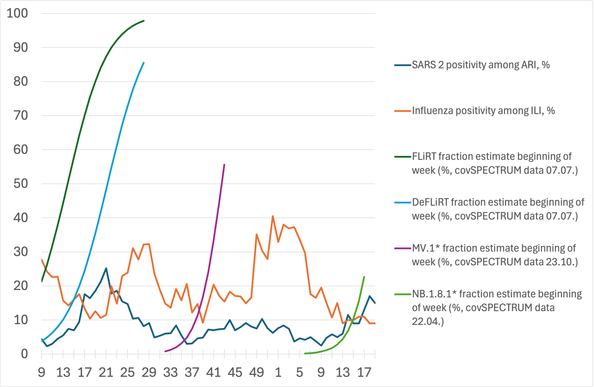
Not clear to me if NB.1.8.1* is the cause.

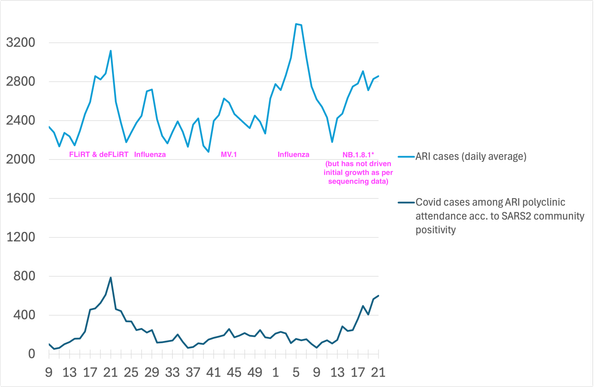
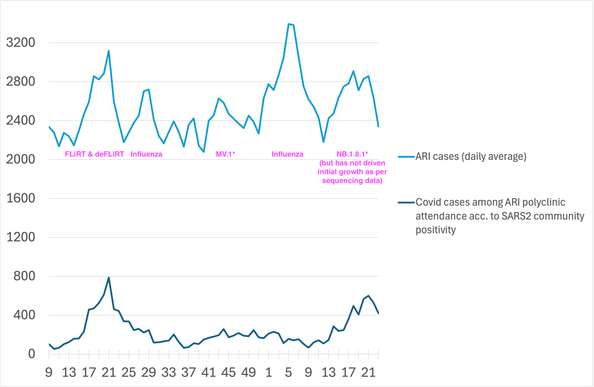
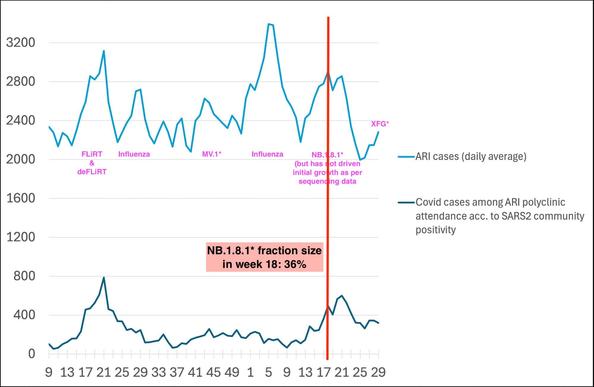
Attached: 3 images #NB.1.8.1* #Covid #Singapore Given the insufficient numbers of seqs, it continues to be hard to say if the rise in Singapore ARI figures is related to NB.1.8.1*. The ARI and SARS2 positivity rise precedes NB1.8.1* fraction growth. Also, ARI numbers seem to rise more then Covid positivity alone would suggest. https://swiss.social/@dominiksteiger/114335575042821674
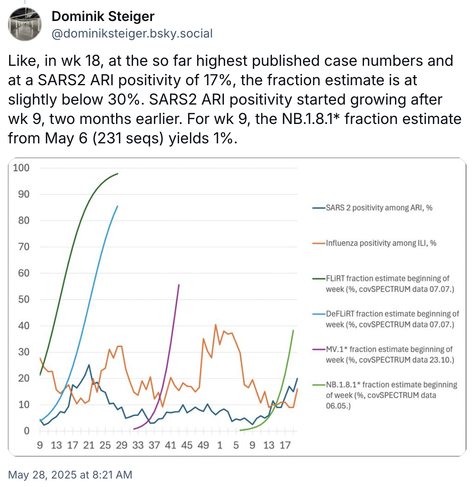
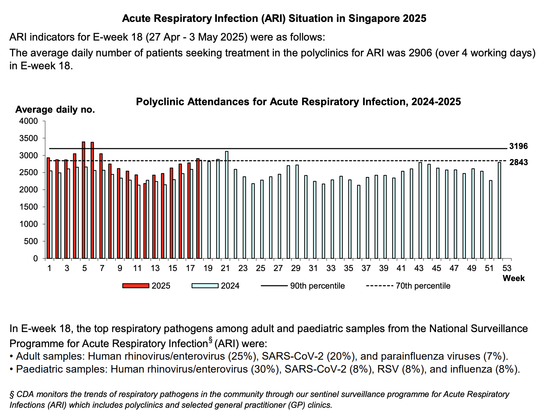
Singapore, update until week 18 2025.
Definitely a Covid wave, one year after the last large.
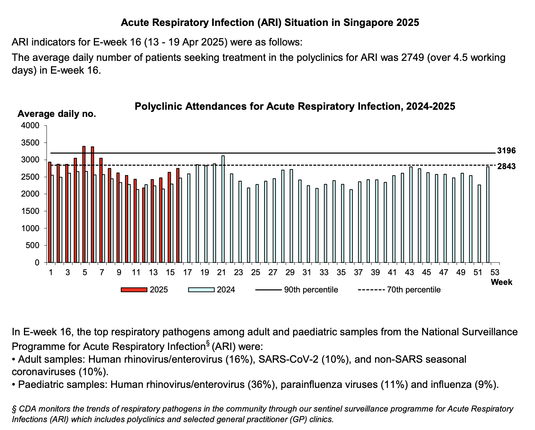
SARS2 positivity among ARI: 17%
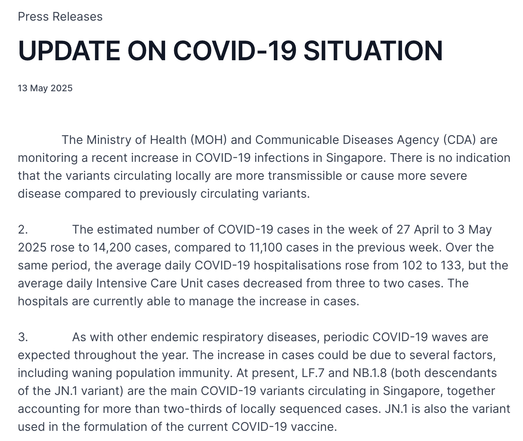
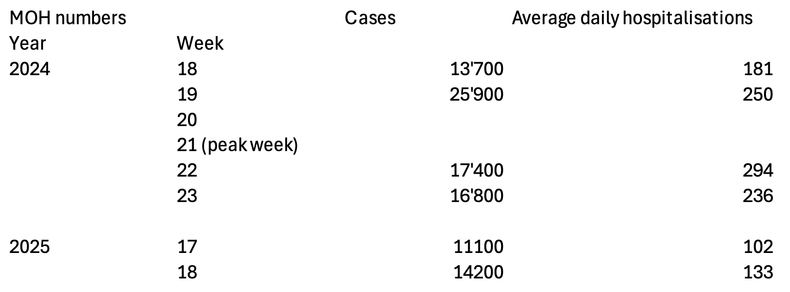
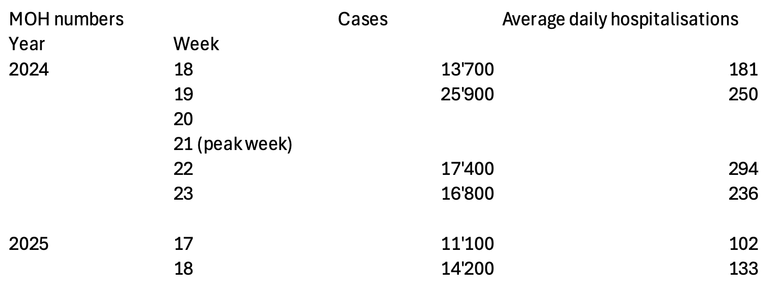
And here the MOH's announcement (from yesterday). They cite
102 daily hospitalisations for wk 17
133 daily hospitalisations for wk 18
Compare to last year's figures.
https://www.moh.gov.sg/newsroom/update-on-covid-19-situation-

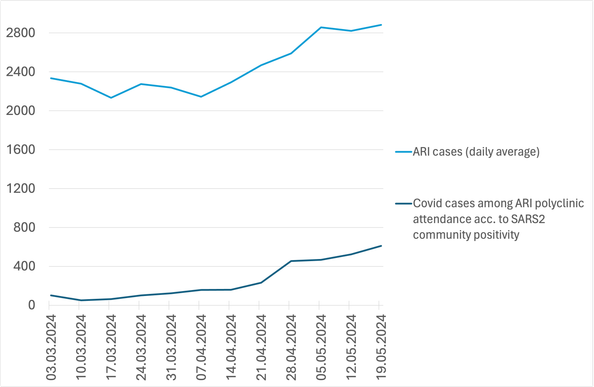
Singapore, update until week 19 2025.
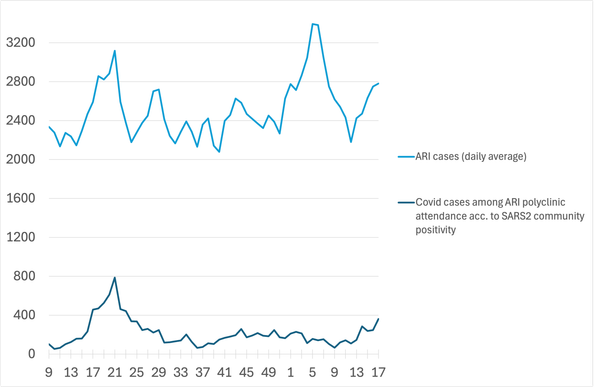
ARI numbers and SARS2 positivity slightly down. If this trend continues, it will have been a much smaller wave than last year.
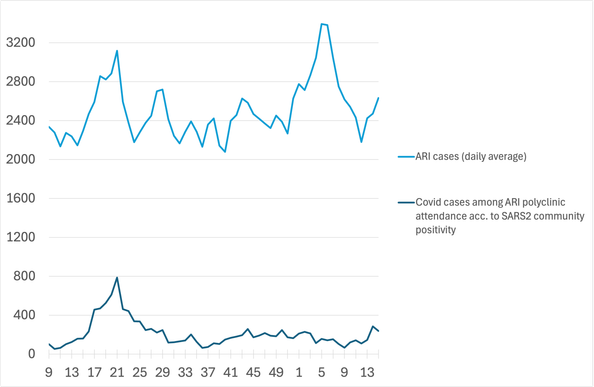
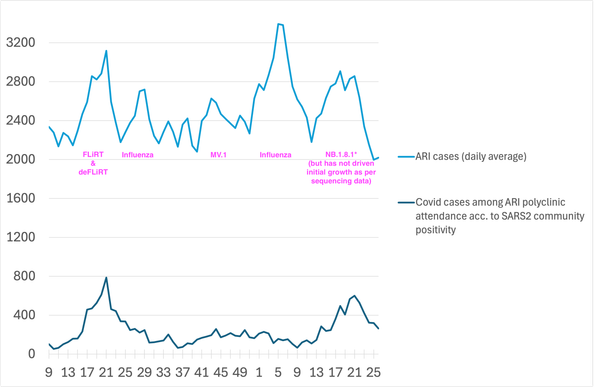
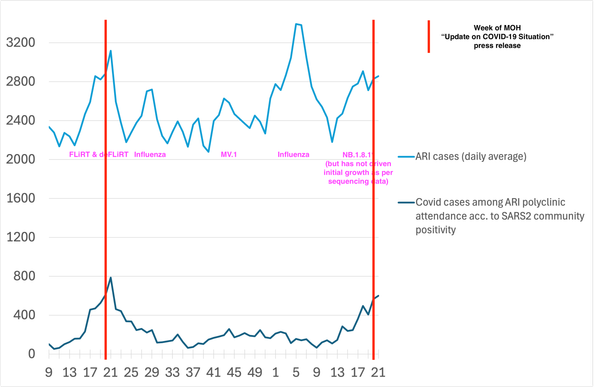
Note the patchy case and hospitalisation numbers derived from occasional press releases.
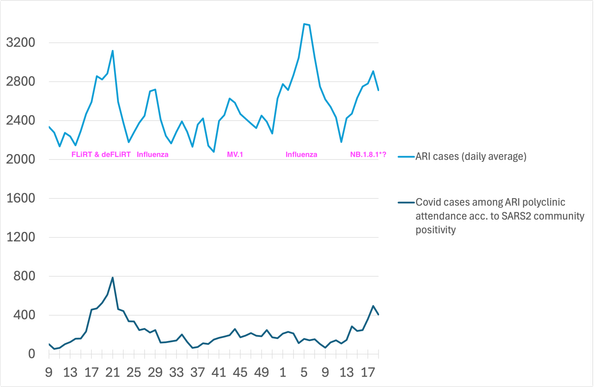
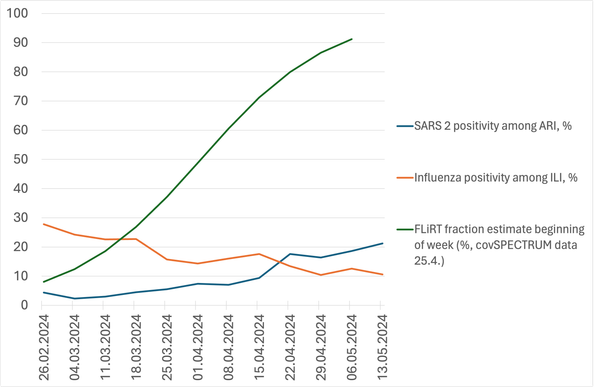
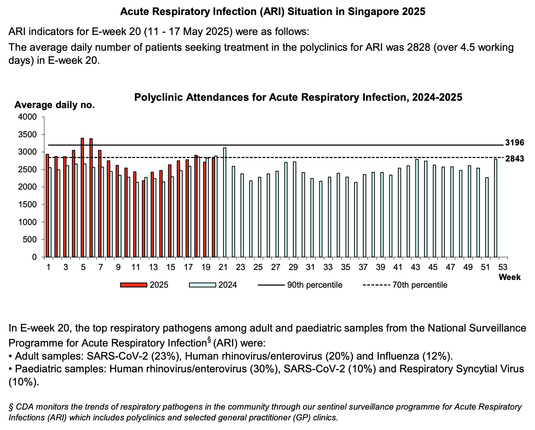
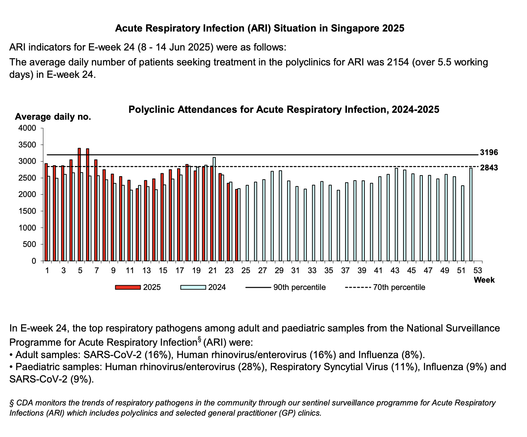
Singapore, update until week 20 2025.
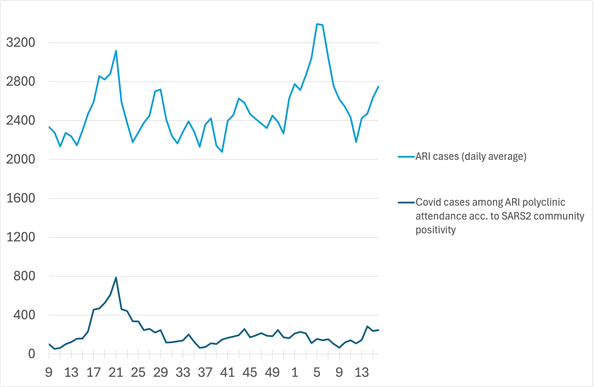
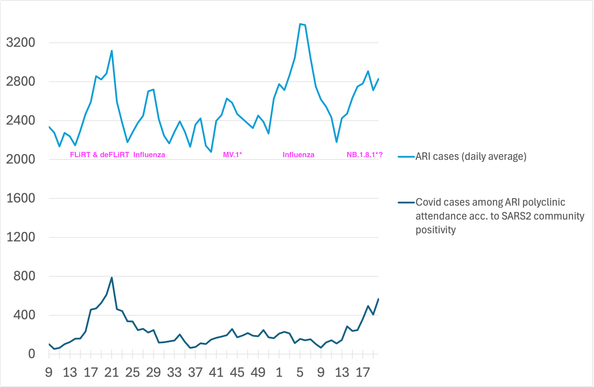
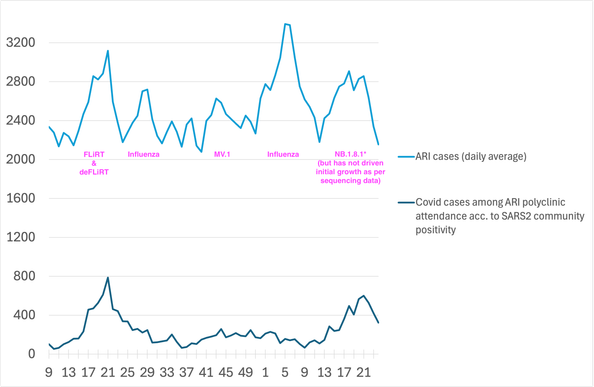
SARS2 positivity among ARI now 20%, close to what was seen at the peak of the wave one year ago.

#Covid wave in #Singapore
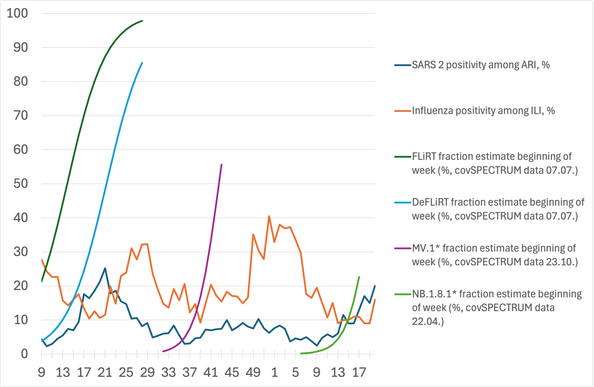
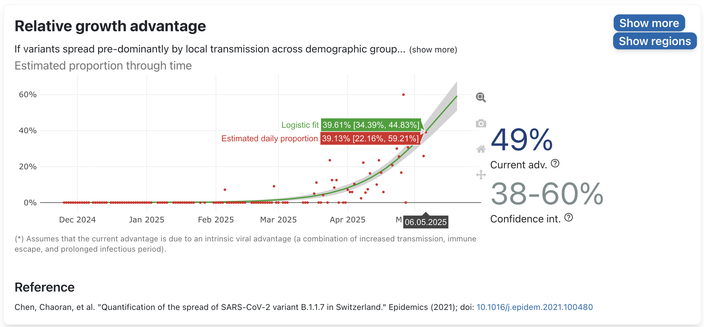
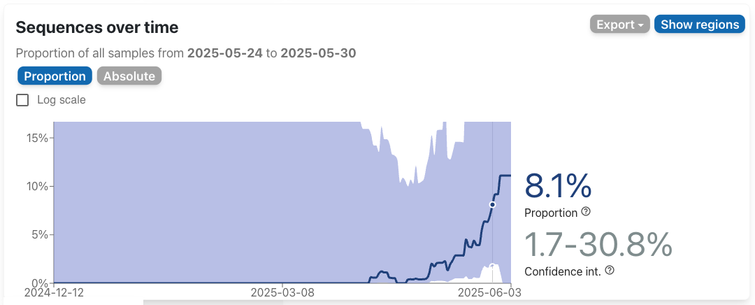
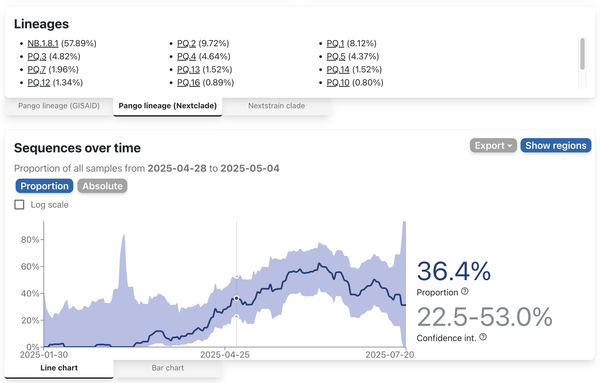
covSPECTRUM has been updated with seqs until 06.05.
The fraction growth estimate for NB.1.8.1* is based on low seq numbers (231 for NB.1.8.1*).
Growth of SARS2 positivity among ARI had started when NB.1.8.1* fraction was still low.

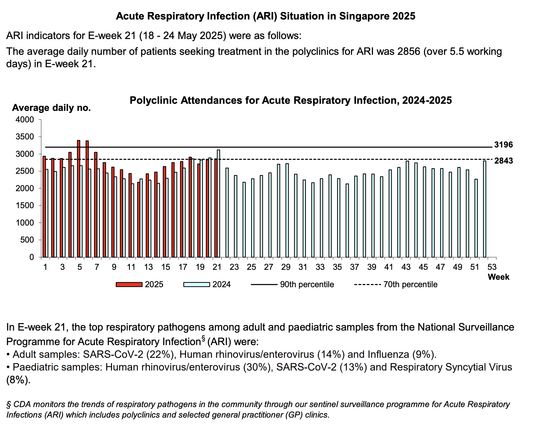
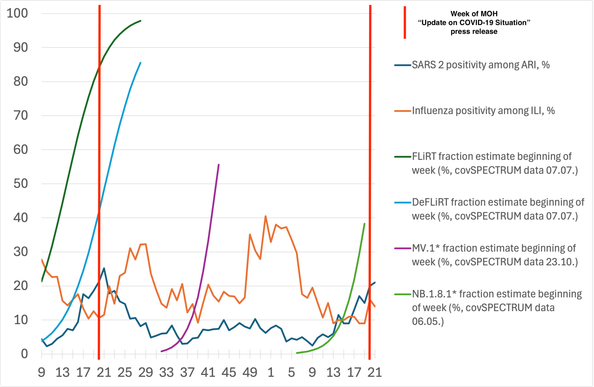
#Covid wave in #Singapore, update until week 21 2025.
SARS2 positivity among ARI and ARI cases have slightly risen.
Will be interesting to see if the MOH will publish new case and hospitalisation data.

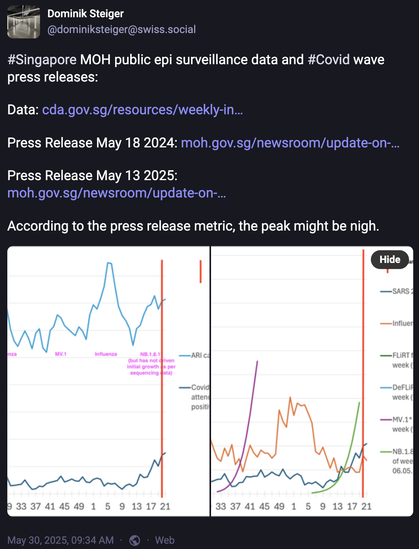
#Singapore MOH public epi surveillance data and #Covid wave press releases:
Data: https://www.cda.gov.sg/resources/weekly-infectious-diseases-bulletin-2025
Press Release May 18 2024: https://www.moh.gov.sg/newsroom/update-on-covid-19-situation
Press Release May 13 2025:
https://www.moh.gov.sg/newsroom/update-on-covid-19-situation-
According to the press release metric, the peak might be nigh.

#Singapore #Covid wave, update until week 22 2025.
Perhaps we've indeed passed the peak.
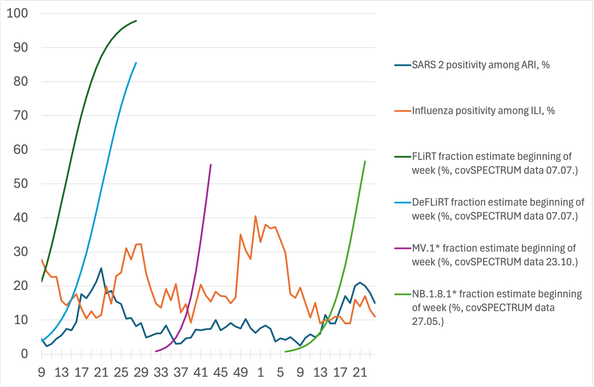
New seq data (last seq date May 16): No change to the conclusion that NB.1.8.1* cannot have driven this wave.

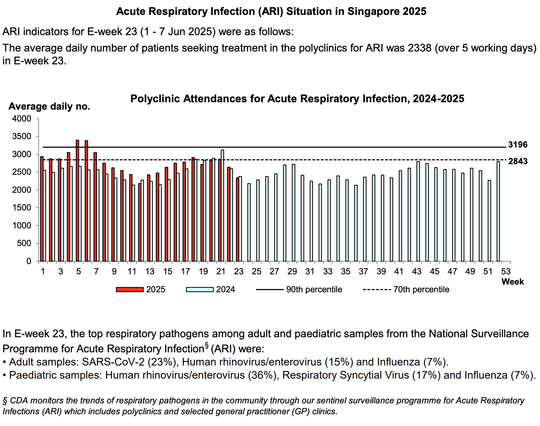
#Singapore #Covid wave, update until week 23 2025.
Seems to have peaked.
New seq data (last seq date May 27): No change to the conclusion that NB.1.8.1* cannot have driven this wave.
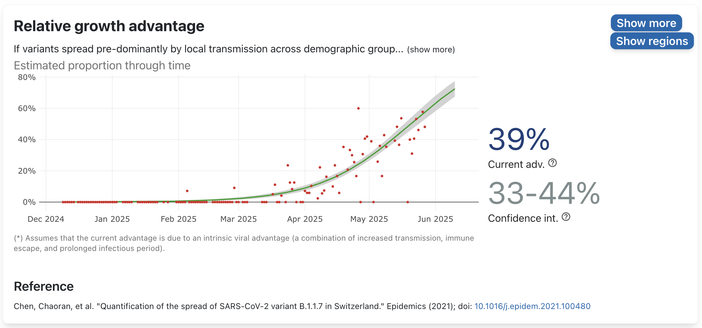
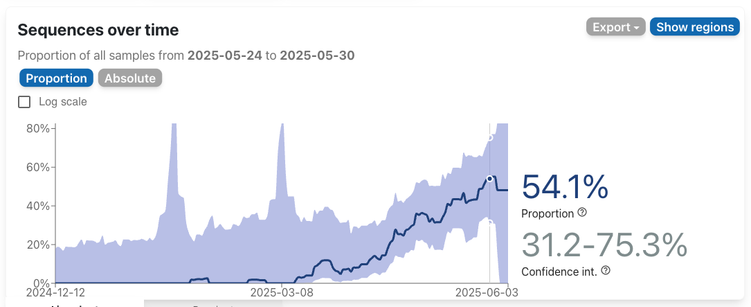
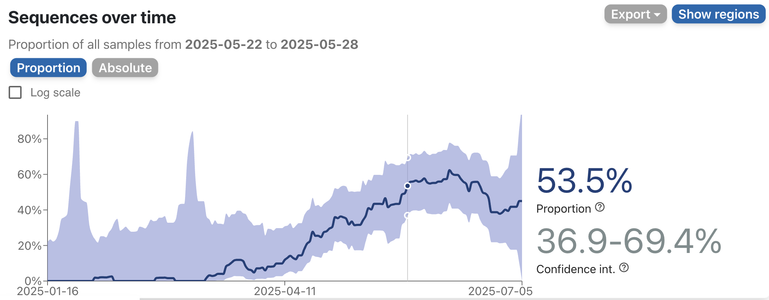
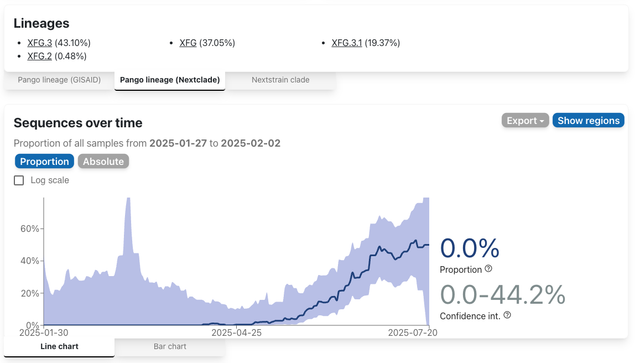
NB.1.8.1* has reached ca. 50% in the presumptive peak week 21 according to the covSPECTRUM estimate.


NB.1.8.1* fraction growth seems to be slowing already (upper figures from covSPECTRUM).
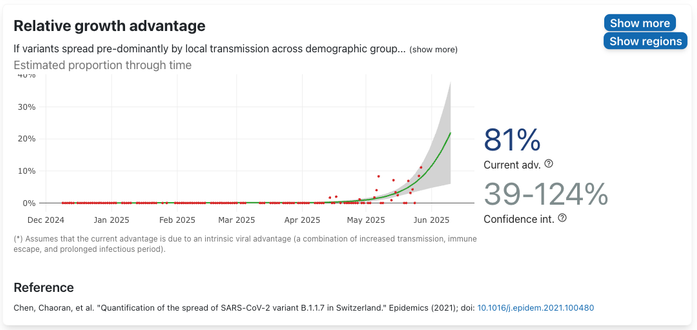
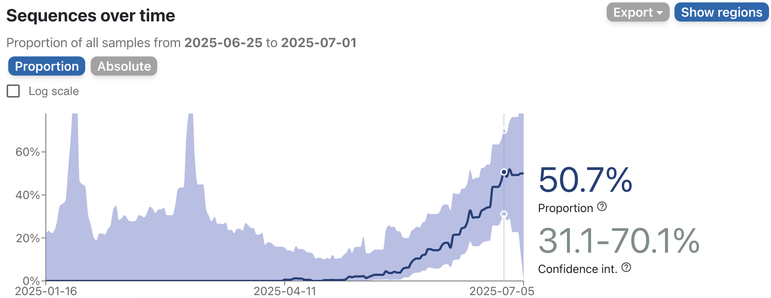
XFG* (lower figures, only 28 sequences) seems to be growing fast, currently still at low fraction size.
We'll see what impact it will have on the currently steeply lowering ARI numbers.

A plausibility check:
Applying the UKHSA Winter CIS IHR (0.45%, https://bsky.app/profile/dominiksteiger.bsky.social/post/3knnplfebjl2b) to the MOH hospitalisation figures:
100 average daily - 7d /100k incidence 12 - 7d /100k infection incidence 2'600
200 average daily - 7d/100k incidence 24 - 7d /100k infection incidence 5'300
Such incidences would be in the order of magnitude range independent measurements and estimates yield for Covid waves.

#Singapore #Covid wave, update until week 24 2025.
The wave has peaked, as expected.
No new seq data that would change the conclusion that NB.1.8.1 has not driven initial growth.
"Nimbus" reached 50% at the peak. Growth started long before it reached significant fraction size.
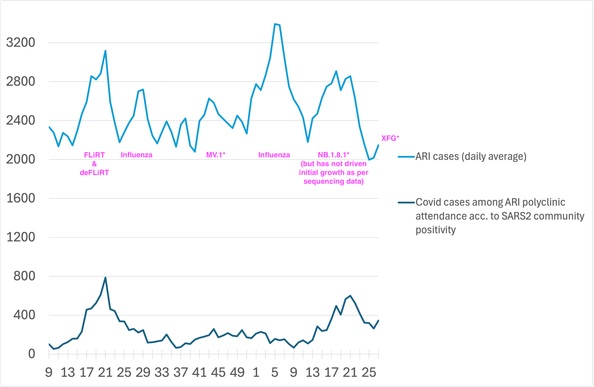
#Singapore #Covid wave, update until week 27 2025.
The recent fast rise of XFG* is slowing the decline.
We will see if it can drive prevalences up.
I continue to not see that NB.1.8.1* has driven the wave. It reached 50% shortly before the peak.
See also:
https://swiss.social/@dominiksteiger/114716297628001828
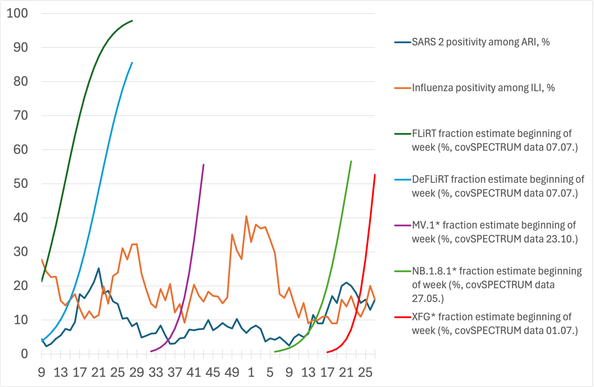
Seq data up until July 1st shows NB.1.8.1* in decline (left). The wave peaked in May.
Seq data for XFG* (right).
https://cov-spectrum.org/explore/Singapore/AllSamples/Past6M/variants?nextcladePangoLineage=XFG*&
See also:
https://swiss.social/@dominiksteiger/114680528689524947
Cf. Switzerland:
Not much of a wave so far, in contrast to Singapore. Recently lowering prevalences, despite XFG* fraction becoming dominant end of May. NB.1.8.1* looking less competitive.
Singapore Covid wave, update until week 28 2025.
The recent fast rise of XFG* continues to slow the decline.
As with last week's data: We will see if it can drive prevalences up.

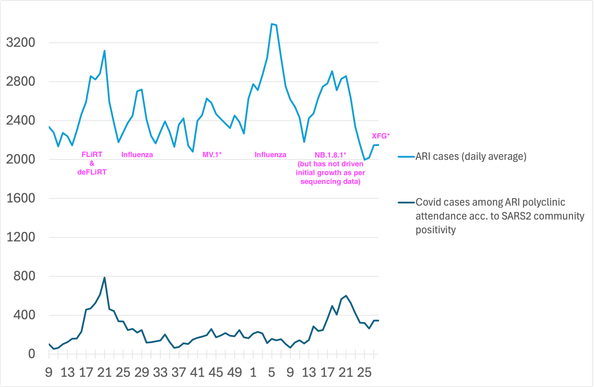
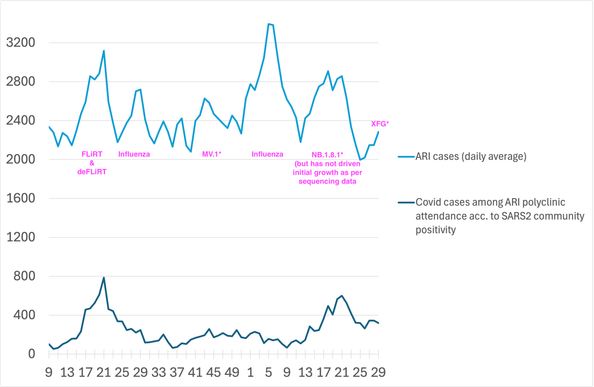
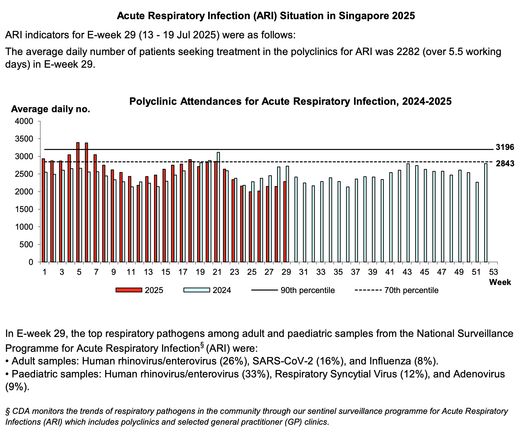
Singapore Covid wave, update until week 29 2025.
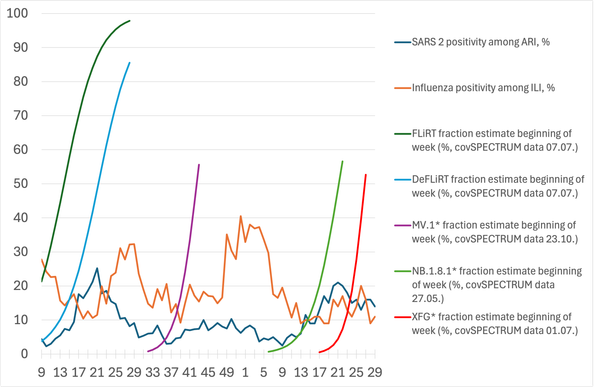
XFG* fraction growth has already stalled beginning of July. Its fast growth could not drive a rise.
Seq data from covSPECTRUM until July 15.
As for NB.1.8.1* before: Currently, population immunity, not variant drift, dominates trajectories.
Covid in Singapore until week 31 2025.
The wave is over. Lowest SARS2 positivity (3%) since February.
XFG* could only slow the decline.
This is now the 2nd year when the Singapore wave preceded trajectories in Europe and North America, its wave occurring quite precisely one year after the last
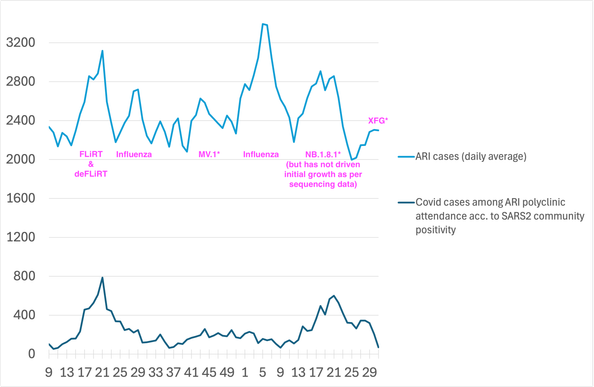
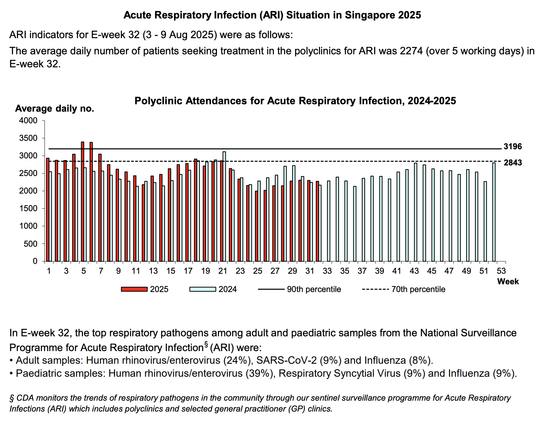
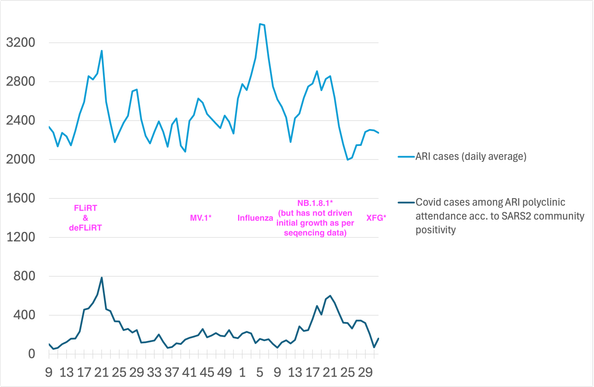
#Covid in #Singapore until week 32 2025.
The last wave (https://www.moh.gov.sg/newsroom/update-on-covid-19-situation-) was likely milder than the one 1 year ago. Note the large influenza wave, too.
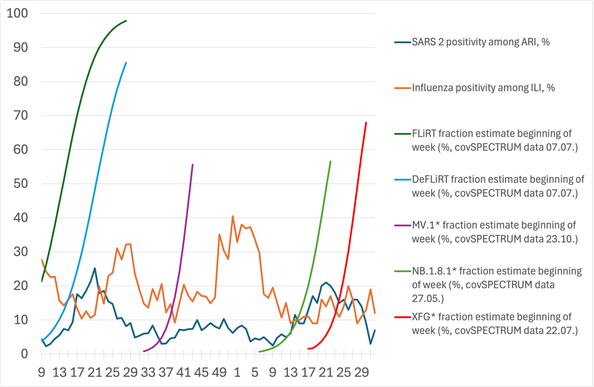
It was not variant-driven, as evident from integrating the available sequencing data with the Singapore epi monitoring data.
1/3
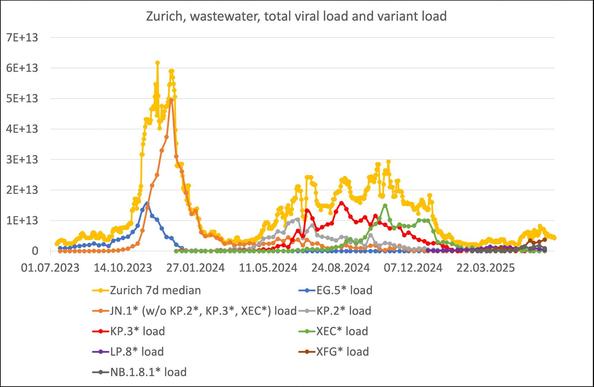
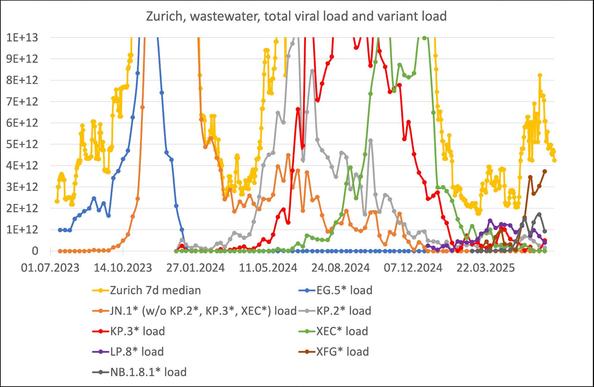
Similarly, NB.1.8.1* ("Nimbus") and XFG* ("Stratus") reaching strong dominance could not drive up prevalences a lot in Switzerland.
As per mid July, they comprised about 80% respectively 100% of the viral load in the two plants shown, and similarly elsewhere.
2/3
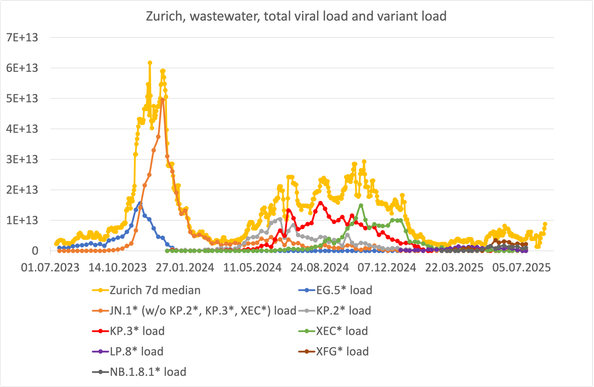
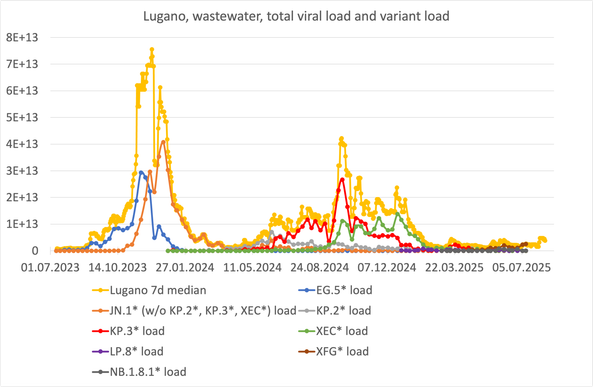
The data suggest that trajectories are currently rather driven by the number of susceptibles (i.e., the state of population immunity), seasonal, and behavioral factors, not by variant replacement.
3/3
#Covid in #Singapore until week 33 2025.
Acc. to the seq data from covSPECTRUM, XFG* is already falling, after failing to have much of an impact. Some NB.1.8.1* derivative(s) seem(s) to have started rising. I doubt that it will make a large difference to the trajectory.