Our #seaice team has developed a Sea Ice Index, online since several years, at https://osisaf-hl.met.no/v2p2-sea-ice-index. It offers visuals of the trends and evolution of sea ice at hemispheric, global and regional scales. It includes the sea-ice extent and area since 1978, and is continuously updated.

The OSI SAF Sea Ice Index is derived from our Global Sea Ice Concentration Climate data record, with R&D input from @esa Climate Change Initiative.
For more info on the product, see:
https://osi-saf.eumetsat.int/products/osi-420
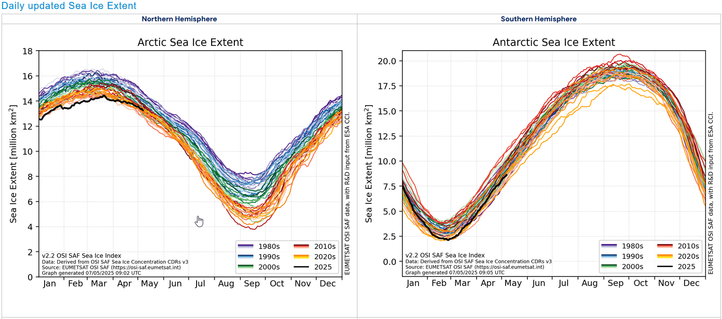
OSI SAF Sea Ice Index v2p2 | osisaf-hl.met.no

Version information This page displays graphs from the OSI SAF Sea Ice Index v2p2: the sea-ice extent time-series plots on this page are all based on our Sea Ice Concentration v3 (climate and near-real-time) data. To learn more about this product, see:

Another visualisation of our Sea Ice Index includes regional visuals and dynamic figures. Have a look at https://cryo.met.no/en/sea-ice-index
We strongly advise you to scroll the index menu down, and have a try at the interactive visualizations!
https://cryo.met.no/en/sea-ice-index-daily

Our #SeaIce team at #MetNorway and #DMI is currently working on an improved version. We will keep you up to date soon!

Sea Ice Index | cryo.met.no

Regional sea-ice index Daily values Svalbard sea-ice extent from Ice Charts Svalbard sea-ice extent from OSI SAF