HPC woes:

5 * MONs with 2 * 100 Gb/s links each
16 OSDs with 2 * 100 Gb/s links each and 1 * 15 TB NVMe each rated at 5,5 GiB/s at 128 KiB IO write

fio says 👌
iperf3 says 👌

Ceph:

#ceph #storage #hpc

@sebulon rant or interested in improving that number?
@blmt Very interrested in improvements, suggestions greatly welcomed! ❤️
@sebulon need to provide some more info: CephFS, RBD or RGW? Ceph version, OSD per NVME, number of pools, PGs per pool, access pattern for the benchmark, number of clients/threads. In addition some NVME specs would be helpful: consumer or enterprise, sustained IOPS at queue depth=1, technology ( QLC, MLC, ..)

@blmt Sure thing!

The NVMe's in question are of model "KCD6XLUL15T3"
https://americas.kioxia.com/content/dam/kioxia/shared/business/ssd/data-center-ssd/asset/productbrief/dSSD-CD6-R-product-brief.pdf

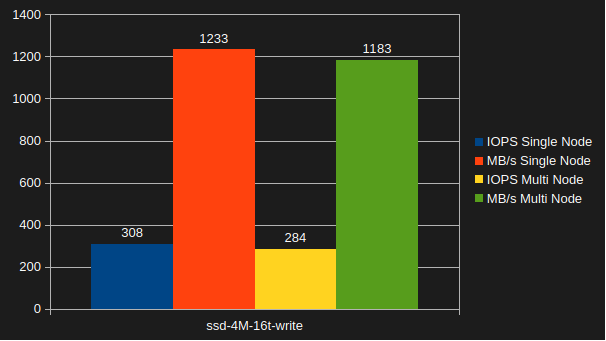
No CephFS, RBD or RGW at this point. This cluster is installed with RHCS 7 (18.2.1-298 to be exact), there are two OSD's/NVMe, just one pool for now, 2048 PG's in the pool with the autoscaler set to only warn and one client doing this:

# rados bench -p radosbench_ssd 60 write -b 4M -t 16 --run-name $(hostname -s) --no-cleanup

@sebulon ok, first some expectation management: Ceph scales well with the number of clients, but single client(thread) performance are limited. You can test a single OSD with `ceph tell osd.1 bench` to have some comparison with FIO. The rados bench will have poorer result per PG (because replication incurs in network latency) but performance should increase well above the 16 threads result by running more rados bench concurrently on separate nodes with more threads. I would run for at least 600s

@blmt These results are from running it for 600s.

The "Multi Node" test are results that are summed from running the same benchmark from 20 different nodes. As you can see having more clients running concurrently has zero impact on the performance, sadly.

@sebulon I am puzzled by those numbers: in our case with twice the amount of NVMEs we get about ~300MB/s for t=1 and we max out for t >= 10 at about 2.7 GB/s. CPU and memory are abundant and uncostrained?

@blmt Haha, yes we are quite puzzled as well! 😄

Although I think (hope) the issue is with the autoscaler setting way too few PGs per pool.

You can create a new pool and set 2048 PGs and then have autoscaler be like: "No actually, there's no data in that pool so I'll scale that down to...mmm...1" 😄

We've changed autoscaler to "warn" now and set the number of PGs back to 2048, and are waiting for the cluster to recover before testing again. I'll report back when the testing is redone.

@sebulon @blmt eyeballing this - just built out a cluster, across 4 racks, with 8x nodes for services (5x mon, 5x mgr,etc), 8x osd.nvme nodes (5x 16TB per node currently), 4x osd.hdd nodes (12x 6TB per node). everything has 2x100GbE to it (mlag/lacp); the osd.nvme nodes are PCIe4 so they can actually take advantage of that, the rest are PCIe3 which just doesn't have the lane bandwidth to do that much, but it's more than enough for mon/mgr or spinny i/o. nvme's are Kioxia KCD8XPUG15T3. fun stuff!