_Finally_ getting around to actually implementing tiled light culling. Which was the original reason I started this renderer... a year+ ago?
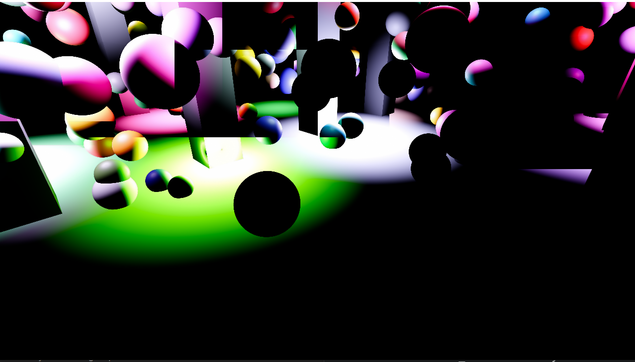
It is, of course, incredibly broken so far:
_Finally_ getting around to actually implementing tiled light culling. Which was the original reason I started this renderer... a year+ ago?
It is, of course, incredibly broken so far:
In classic programming fashion, the bug was _not_ in the complicated culling math (which I rewrote twice in an attempt to root out the bug). Instead, it was an bug in how I was computing the bit index of a light to add it to the visibility mask.
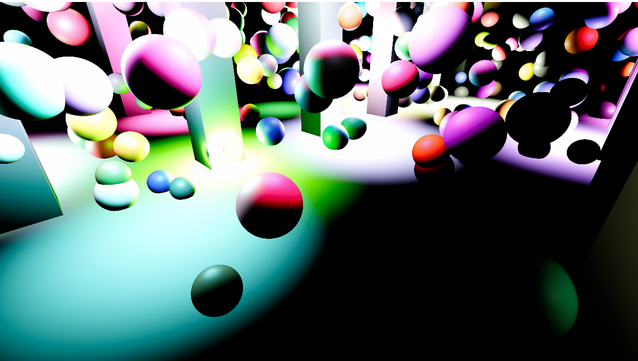
Works now!
Heatmap view, with the light count in the scene raised to 256.
There's two culling tests, and a light is only marked visible if it passes both:
- inside the planes of the subfrustum
- inside the viewspace AABB of the subfrustum
AABB only is decent, but falls flat on edges. Frustum only is _awful_. The two together do a pretty good job, though.

Performance is interesting at 1440p.
Culling enabled:
- cull pass: 0.7ms
- lighting pass: 0.8ms
Culling disabled (just filling the bitmask for active lights):
- cull pass: 0.08ms
- lighting pass: ~4ms
Definitely a win (although with fewer lights / lower resolution it's a much narrower gap). Weird that cull and lighting take pretty much the same amount of time, though.
For further context, the gbuffer pass takes 2.5ms at 1440p. Which is quite an interesting reversal from what I'd expect.
Part of that is that I haven't really implemented some of the more complex shading yet (all bog-standard GGX and Lambert so far). But these are all sphere area lights, not point lights. I'm _trying_ to do expensive stuff in the lighting pass and apparently failing.
With 16x16 tiles at 1440p, we end up with 14400 tiles (interesting coincidence, that.)
32 4-byte words per tile to store the light bitmask, which all adds up to about 1.75MB of buffer data. Less than I expected, to be honest.
This gives us a limit of 1024 lights; we could expand this buffer easily, but the 1024 limit is _actually_ caused by the UBO storing light data. (64 byte struct, so we can only fit 1K of them.) Lots of that data could be packed, but that has other consequences.
Okay, filling out the scene with the maximum of 1024 lights makes for a more interesting performance result:
No culling:
- cull pass: 0.1ms
- lighting pass: 27ms 😬
With culling:
- cull pass: 4.5ms
- lighting pass: 2.4ms
Interesting that the culling is the bottleneck, not lighting. Definitely some inefficiencies in my implementation there, but the per-light cost should be pretty thin already.
Maybe I need to look into doing culling with raster instead?
Slightly different view, so the numbers aren't directly comparable to before but:
- cull pass: 4.6ms
- lighting pass: 4.2ms
Looking at the ratios, lighting definitely got worse relative to culling here. Which makes sense, we end up with 64+ lights in these tiles (which is the maximum my heatmap will display; entirely possible it's _much_ worse than that.)
It's deeply satisfying to me how much I can get away with on this GPU and still hit 16ms.
Like... "every shader does discard" was a real, serious performance problem I've had to solve at work (protip: discard on phones is Very Bad), and this thing doesn't even blink. It's refreshing.

Okay, remapping with:
`log2(float(count) + 1.0) / 2.0`
This gives blue at 3, green at 15, red at 63, and white at 255:

So in this worst case stress test, we have quite a few tiles with more than 255 _false positive_ lights.
Definitely some room for improvement, then!
Figured out why my tile culling was broken at 1080p (where the vertical resolution is not evenly divisible by 16.)
_Two_ separate off-by-one errors, in clamping for min/max depth pass, as well as in the pixel->tile lookup for shading.
There's an argument to be made that min/max depth should be computed in the same pass as culling. However, it turns out the the culling pass has some odd scaling behavior for different group sizes:
(1080p, 1024 lights)
- 32: 1.95ms
- 64: 2.75ms
- 128: 3.05ms
- 256: 2.99ms
- 1024: 2.73ms
In general, culling seems to scale poorly with increased thread count (although it peaks and starts getting better past 128?)
16x16 thread group would be 256, one of the worst cases.
Although, come to think of it, we only sample one channel for depth, and we're doing a reduction, so 8x8 with a single gather per thread should be sufficient. And then we can skip the bandwidth / barrier overhead of the minmax pass.
(There's additional benefits, because having the depth information in cull pass is actually really useful, enables 2.5D culling.)
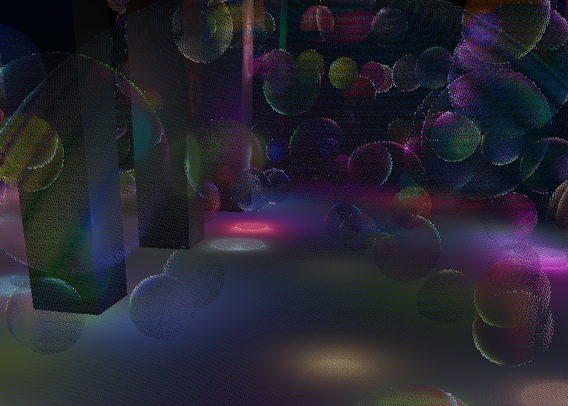
Implemented 2.5D culling. (Basic idea: after computing min/max depth for the tile, slice it into 32 ranges, build a bitmask of depths that are present. Build the same for lights. Only accept lights that intersect the depth mask.)
From these A/B shots (false positive heatmap), you can see that it does help. A little. But the mask for the light is very crude, just uses the min/max in view space, doesn't account for the bounding sphere.


It's pretty cheap to do (costs less than I saved moving the min/max depth computation into the culling shader), so it's probably worth having. Doesn't have a huge effect on lighting pass time, though.
I think that exhausts the "typical" tiled lighting culling options I'm aware of. Moving forward, options are to rasterize light volumes or to do a 3D grid instead of 2D.
Do not use a uniform buffer / CBV if every thread is going to access a different index.
One of those tiny bits of trivia you pick up over time and then forget until you step on that particular rake again and get a sharp reminder and a bruised ego.
Weirdly this also seems to make the following lighting pass faster. Which doesn't make sense to me, there's a barrier between them so there shouldn't be any execution overlap.
(Unless the driver can move that barrier across my timestamp queries... which TBH seems like something OpenGL would allow.)
On further thought, these are memory barriers, not execution barriers, so it makes total sense that timestamp queries would not be affected (queries don't read any of the data being written by the shader.)
So reading two GL_TIMESTAMP queries is a top-of-pipe -> top-of-pipe timing, not top-of-pipe -> bottom-of-pipe timing. Hmm. I may need to rewrite my timers.
Annoyingly, while GL_TIME_ELAPSED gives proper TOP->BOP timing, it requires using a begin/end pair, and glEndQuery doesn't take an id.
So they can't be nested. I kinda get it (the end query probably flushes the pipeline, so you'd get bad timings from the outer query) but it's kind of annoying if you want to time both individual passes and the entire frame as a whole.
Okay, it's possible that I can hack around this by adding a `glFenceSync(GL_SYNC_GPU_COMMANDS_COMPLETE);` before querying each end timestamp.
I'm hoping this doesn't, like, actually create a fence and instead is just signaling a shared fence with a monotonic counter. Would be horrifying to create a new fence each time just for the byproduct of an execution barrier.
Okay, no, compared to GL_TIME_ELAPSED the fence has a pretty steep tax (~40us), and because the timestamp then _includes_ the fence command itself, this spoils things.
I think the answer is to do GL_TIME_ELAPSED for per-pass timing (where I care about the details), and raw timestamp queries for total frame time (where TOP->TOP is... fine, I guess.)
@oblomov not packaged nicely like that, but you can build what you need in more modern APIs like Vulkan and DX12.
OpenGL not so much, because the API doesn't expose constructs like "record this timestamp after all FS work preceding it has completed."