I am using daily the #Ruby debug gem and a while back I transitioned from simply writing `binding.break` to wanting to skip a step and start the breakpoint by showing the current local and instance variables by writing
When adding this line in the code:
`binding.break(pre: 'ls ;; i')`
it will display directly both ls and info output like in the image attached here.
So I wanted to configure this as code snippet in both RubyMine and VSCode.
Here is how it looks like when using a code snippet in Visual Studio Code
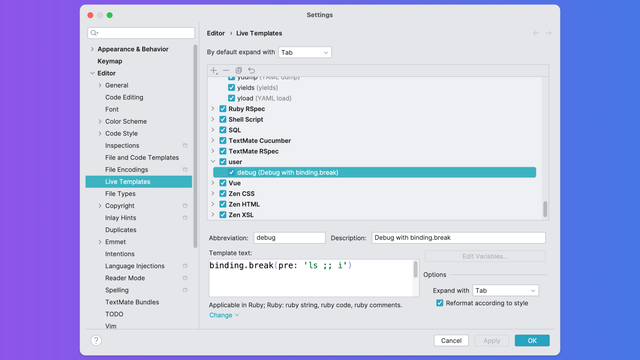
And here it how it looks like when using the code snippet in Ruby Mine
In RubyMine code snippets are called LiveTemplates and you can find it under Settings.
There just add a new Live Template give it an abbreviation, write the replacement text, choose when to apply it and the expand option.
There just add a new Live Template give it an abbreviation, write the replacement text, choose when to apply it and the expand option.
In Visual Studio Code you have the option to add the code either locally in the current repo or globally. I like to use the same shortcuts in all my projects so I created a global code snippet file.
You can find the option under Settings -> Configure User Snippets and just add

You can find all these steps detailed in an article I published on my blog at https://allaboutcoding.ghinda.com/add-code-snippet-in-rubymine-and-visual-studio-code-to-bindingbreak

@lucian would you not just use the built-in debugger in RubyMine? It's one of the reasons I buy the product