I don't understand the people who told me I would get more conservative with age. The more powerful I become, the more angry I get at the people who abuse their power and the more aware I become of the ways in which systemic oppression functions.
20-year old me totally believed that tech was a meritocracy where people pulled themselves up by their bootstraps and that the 30-something guys I dated were attracted to me because I was so mature.
In other news, I am reading "Capital in the 21st Century" by Thomas Picketty and I am so angry at baby boomers right now.
@evacide Our parents ran the show. Their leaders remained well in2 our adulthood. Boomer kids were spat upon by our "greatest generation" elders.
These articles are crap.
Insulted well into our 30's. greatest generation called my sister and I "you children" when insisting we butt out of everything surrounding my father's death. Kids @ 35.
We were whipped with belts. Our treatment for TBI was "suck it up."
In the 7th grade 3 of us kids talked Mom out of fear of mixed marriages.
Stop the tar.
It's wildly under-appreciated how much issues today were caused by rapid increase in lifespan. I found this chart: https://u.demog.berkeley.edu/~andrew/1918/figure2.html
Life expectancy at birth born in 1900 was about 46 years for men. It was 65 in 1950. It was 70 in 1980
Institutions changed much slower than life expectancy. Concentrating wealth towards elders made more sense when "elder" was "the father of 10 year olds" rather than "the father of 65 year olds"
@dlakelan @stevesplace @evacide how much of the change in life expectancy is from fewer children dying vs adults living longer?
@Natanael_L
I would guess that fewer children dying is an important part of it but certainly not all there was a massive shift in employment in the US for example something like 90% of everyone was a farmer in 1900 and it's like less than 1% now farming is dramatically more dangerous then lots of other professions now, lots of people died in accidents or from disease
@stevesplace @evacide
@Natanael_L @stevesplace @evacide
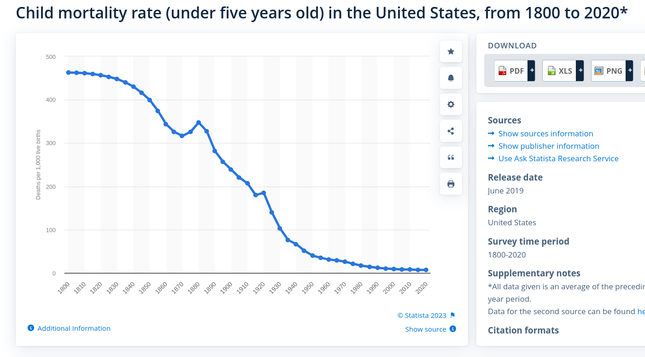
It may be mostly children though based on this: https://www.statista.com/statistics/1041693/united-states-all-time-child-mortality-rate/

@dlakelan @Natanael_L @evacide But if you had more births, and everyone died at age 14, would that make the maximum age rise?
Medicine and ample food, no wars since the Civil War and education have all contributed.
@stevesplace @Natanael_L @evacide
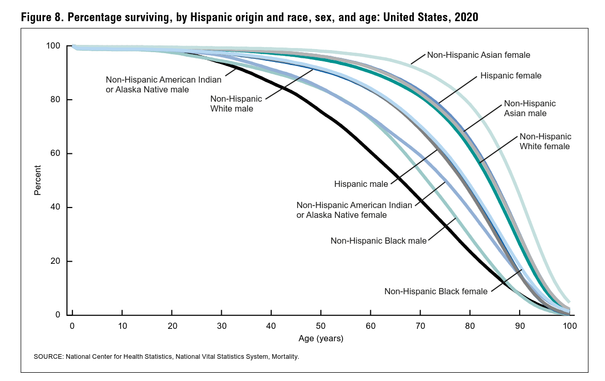
You're right that the distribution matters, and that the expectancy isn't giving us all the information we need. However you can see a steady rise in the right tail of age in other sources. Like CDC life tables, where perhaps the different demographics give us an idea also of different times. The people benefiting the most from modern medicine etc are living deeper into the range of 80-90 etc while other demographics probably more similar to older time periods
@stevesplace @Natanael_L @evacide
The 1966 CDC life tables are interesting for this question... For example out of 100k MEN born 70 years before 1966, only 36% of them were still alive at age 70 in 1966.
Compare to today... of 100k males born 70 years before 2020 about 68% of them still alive today
@stevesplace @Natanael_L @evacide
Also the 1920 census could be compared to the 2020 census https://www2.census.gov/library/publications/decennial/1920/volume-2/41084484v2ch03.pdf
Just hilighting one data point, in 1920 there were 200k males age 70
in 2020 there were about 1.5 Million or almost a factor of 10 larger.
https://www.census.gov/data/tables/2020/demo/age-and-sex/2020-age-sex-composition.html
@stevesplace @Natanael_L @evacide
Comparatively, there were 800k 20 year olds, then, and about 2.2M now. So 70yo/20yo ratio was about 0.25 in 1920 and is now about 0.68. Close to 3x as prevalent today.