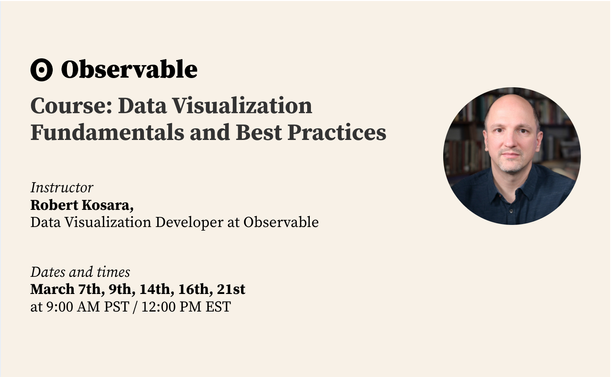
🧠 Beginning on March 7th, Data Visualization Developer Robert Kosara @eagereyes will lead Observable's Data Visualization Fundamentals and Best Practices course.
Sign up here: http://ow.ly/CF3F50N0Os0
Course: Data Visualization Fundamentals and Best Practices
When do you use a bar chart over a line chart? What are area charts good for? What's wrong with pie charts? Learn about how these different types of data visualization work, and how they're used, in Observable's first data visualization course! Attend lectures (or watch them later), ask questions, and once you've completed a small assignment at the end, you'll earn a certificate. What you'll learn With Observable Plot, you can build data visualizations in half the time it takes in other tools. And, we’re he
