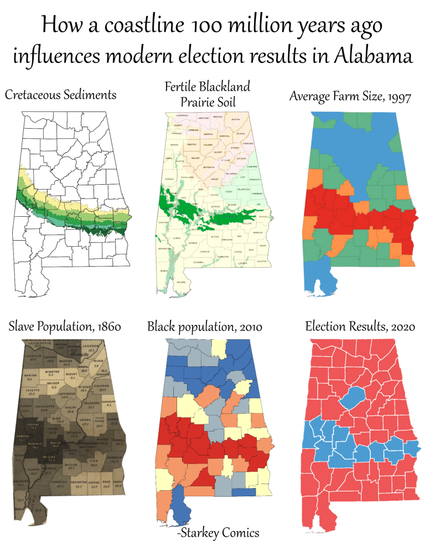
How a coastline 100 million years ago influences modern election results in Alabama - Starkey Comics

If (like me) you enjoy looking at maps, you might sometimes wonder why a map looks a the way it does. The events leading to a certain demographic being more common here, or a border being drawn there, can often be very complex, and fascinating.Here I’ve gathered 6 maps of the US state of Alabama. […]

Starkey Comics
@davidho @seis_matters On a day when American government turmoil is in the headlines again, this thought about the role of geology in politics and society is intriguing.

@davidho @seis_matters

Thanks for making and/or posting this infographic! 👍

A similar control on socio-economics is apparent in Scotland. In the image I have over-plotted areas of coal-bearing strata on a map of the Scottish Index of Multiple Deprivation. The correlation is poor in the main urban areas, but in rural areas/smaller towns the association of former coal mining & high deprivation rates (red) is strong. Most of these areas were historically Labour supporting.

@davidho @seis_matters

@geomannie @davidho Ooooo…fascinating! Would you be interested in doing something UK-wide about this?!
@seis_matters @davidho
In theory I would be interested but would need to have a think about it. The English deprivation index is a separate dataset. An easier ask might be to see if voting results by postcode are available & overplot them with geology. Cheers!
@geomannie @davidho @seis_matters a PhD student of mine is exploring minewater geothermal heating for low-income post-industrial communities in Scotland. Very happy to connect you in.
@matthannon @davidho @seis_matters
Hi Matt, thanks for the offer but this is just a casual map I made simply because I was interested. I'm not going to be actively pursuing this subject very much as I answered my simple question.