"I am 63. I am scared for my own life. You should be too. And I am absolutely terrified for the life of my son."

Says one of the experts at the UK National Emergency Briefing. The video is a medley of just a few of the best Oh-Shit-Moments.

Tim Lenton appears as well. His short Oh-Shit scene relates to the AMOC slowdown.
And by the way: the Utrechter Team around #vanWesten published a new study.
https://www.nature.com/articles/s43247-026-03309-1
"Abrupt Gulf Stream path changes are a precursor to a collapse"
High-resolution modelling reveals an exact Oh-Shit location for observing imminent tipping: 2 years before tipping into the collapse phase, the Gulf-Stream surface water transport ( one part of the AMOC), jumps 200km north.
Instead of turning right near Cape Hatteras, it then continues North and only turns right on the latitude of Philadelphia.
The area between the two turning points also experiences an equally sudden jump in surface temperature of +6°C.

These surface changes occur because the deep-water current beneath it stops its Southward flow.

#AMOC #UKNEbriefing #NEbriefing #NationalEmergencyBriefing

New AMOC paper by vanWesten's team in Utrecht
https://agupubs.onlinelibrary.wiley.com/doi/10.1029/2025JC022651

This study isn't about collapse impacts, but they do add some information.
2 other also published papers concern impacts and are cited in the conclusion at the end of the paper.

What this study wanted to determine: where is the early warning signal location so we can monitor and estimate the time of arrival?
Earlier studies by the team also searched for it. And one pointed to Southern Atlantic at 34°S. I recall hearing vanWesten say on a podcast (ClimateChat maybe?), that the Cold Blob in the North Atlantic Subpolar Gyre is not a good location.
But: that one at 34°S was found during the experiment of a pre-industrial hosing experiment without climate change.

Now they looked again and specifically under climate change and specifically at the Cold Blob.
Turns out, in some conditions, it is a very good early warning location, in others not so much, namely with big freshwater pulses.
Or at least, that's how I understand the Conclusion part of the paper.

That 34°S turns out to be not a good location in real world climate change (IUUC) is quite good. Because high-resolution proxies about past behaviour have not been studied from there, and monitoring by ships is too scarce, making reanalyses like EN4 by UKMetOffice for example, unreliable in that area in the South Atlantic.
We'd be flying blind if 34°S were the canary in the coal mine. 🖖🏽
#AMOC
#ClimateChange
#Tipping
#Collapse
#Europe
#vanWesten

@AlexanderVI @EarthOrgUK @JeffC1956 @Sustainable2050

The paper is open access.
https://agupubs.onlinelibrary.wiley.com/doi/10.1029/2025JC022651
And while the study wasn't about impacts,
they did add 4 maps of Europe for temperature after the 2 emission scenarios and 2 hosing speeds,
along with line charts of annual temperature average for Iceland, Bergen, Vienna, Madrid and London until year 2400 under these scenarios/speeds.

From my memory (so you best verify):
Temperature evolution doesn't become at all worrisome in 2 emission scenarios/speeds, and very worrisome in the other 2 scenarios/speeds from some time in the next(!) century for Bergen and Iceland.

In words, they add the information that winter storms and winter precipitation change in all 4 scenarios/speeds, as does the tropical rain belt.
I add: annual average temperature says nothing about temperature extremes. Which will be the stuff of future studies, I expect. 🖖🏽

#AMOC #ClimateChange #Tipping #Collapse #Europe #vanWesten

A new paper on #AMOC

Prose summary by the authors https://theconversation.com/meltwater-from-greenland-and-the-arctic-is-weakening-ocean-circulation-speeding-up-warming-down-south-238302

Free ePDF https://www.nature.com/articles/s41561-024-01568-1.epdf?sharing_token=O3cvnzvEWDHiaPGAV-CB3dRgN0jAjWel9jnR3ZoTv0M2PsD_MIel1A6mz6UbuhaTQSv4VfXkSU9okrbFGA0gy1etRpvwJw0P0tMsHg9ro8Nv1h-GiKg-3Km08jevWj3MVZ6uFzlIrUTv-X1bF8I0K8crc3qdtYsHtgUTx9fE2Zc%3D

actual paper https://www.nature.com/articles/s41561-024-01568-1 #Pontes et al 2024

tldr: by adjusting #Greenland meltrate to actually observed accelerated rate which is underestimated in standard climate models, they are now able to explain the observed increase in SST and salinity in the South #Atlantic with a slowdown of the AMOC in the past decades , matching the slowdown rate calculated by #Rahmstorf 's former PhD student #Caesar 2018.
If you recall, that's the latitude in the S-Atlantic that #vanWesten etal 2024 found as prime location for early warning signal of an imminent AMOC collapse in their freshwater experiment.

By applying melt (but without the observed AND projected acceleration that #Greene et al 2024 notify us of https://www.nature.com/articles/s41586-023-06863-2 ), Pontes' model now projects a total slowdown of 30% by 2040.
(Also noteworthy maybe that the authors pull the 2degree milestone forward to 2040, while some papers I read in 2018 still saw 2C sometime in the 2050s. But they're not the first researchers doing so that I came across.)

Meltrate in Greenland is 30Mt of ice per hour... Did you know that 1kg of pizza equals 19kg CO2 which ultimately melts 12.3 t glacial ice?
1 cup of coffee is 400gr CO2 and melts 260 kg. (sources see #2)

Meanwhile, #COP29 news falsely report a global consensus in coal phase-out. A journalist on Bluesky dug into the actual agreement and the countries listed.
First, it's not a global agreement.
Then either, the countries have no coal energy, or they have already long ago planned the phaseout so nothing new from them, either.
The single country with a new development in this coal agreement is Australia which announced to close 3 coal power plants ... sometime in the future...

Meltwater from Greenland and the Arctic is weakening ocean circulation, speeding up warming down south

New research shows melting ice is causing the Atlantic Meridional Overturning Circulation (AMOC) to slow down, with widespread consequences for the world’s climate and ecosystems.

The Conversation

#Bierman made the news in 2023 with a leaf found rock-bottom of an ice core from West Greenland.

His research history up to then:

Bierman 2014: Summit ice steady for past 2.7My as Be-Analysis shows
Bierman 2016: Be-record of East Greenland: ice stable for 7My.
Bierman 2023: leaves found in West Greenland, age 400ky.

I had tweeted that history last year and asked for verification in the other ice cores 😁
https://x.com/anlomedad/status/1682586415148724229

So now Bierman re-visited an ice core from Greenland Summit et voilà! Summit was ice free at least 1.1 Ma: https://theconversation.com/ancient-poppy-seeds-and-willow-wood-offer-clues-to-the-greenland-ice-sheets-last-meltdown-and-a-glimpse-into-a-warmer-future-233183
or paper https://www.pnas.org/doi/10.1073/pnas.2407465121

Sadly not dated more stringently. (Why not tho?)

The distance from West-GL to Summit is only like Bordeaux to Bonn, so I'll simply assume, Greenland was near-ice free 400ka in MIS11, too.

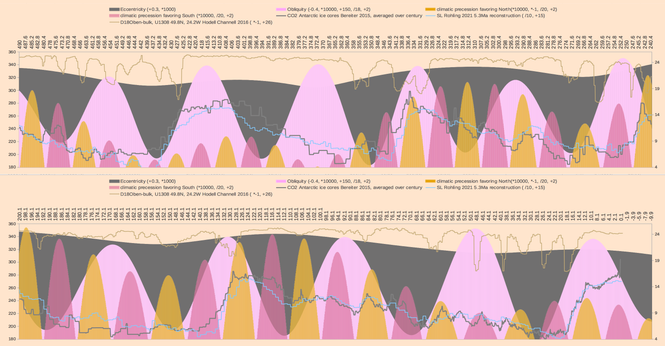
Which would strengthen the argument further that #AMOC gets tipsy from the speed at which freshwater is added, not the amount. Because: the sediment core plotted in the image in my post above shows how AMOC didn't tip at all in MIS11, despite Greenland being near or completely ice free (not only WestGreenland as I wrote in that post. I just hadn't seen the new article yet.)

And if that's the case: speed over amount,
then the freshwater experiment in #vanWesten 2024 is rather non-informative regarding our situation today.

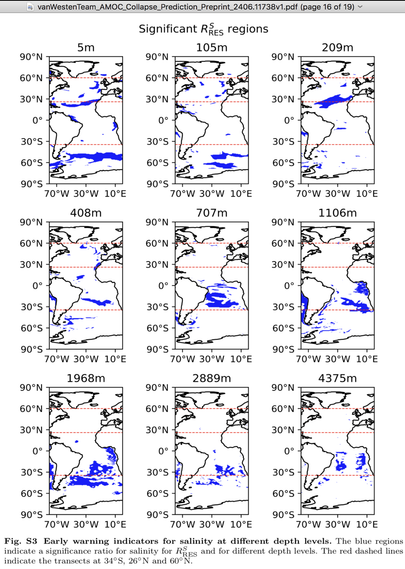
High speed of freshwater inflow might even affect the Early Warning Signals they found – and on which they subsequently based the other 2 papers (which resulted in 2037-2064 and 2065/2085 as tipping years).

I mean, if you stress the system slowly, gradually, like in vanWesten's experiment or probably like it happened 400ka in MIS11, and also always wait for the system to find its equilibrium again,
then the Early Warning Signals might come at totally different locations
than when you stress the system with burst of huge amounts of freshwater like in our real world under forcings from fossil fuels and land use change.

It's like when one of your legs is shorter.
Increasing the stress on your skewed skeleton slowly by doing only very little leg-intense sports would for example lead to back pain after 10 years.

But if you stress your skeleton in burst of high forces like playing volleyball twice weekly, it's your knee that gives out and makes you stop stressing your skeleton altogether, long before your back would start to hurt.

anlomedad 🐘 @[email protected] 🐘 (@anlomedad) on X

@WeatherProf https://t.co/VwBxxIc1kb Bierman 2014: Summit ice steady for past 2.7My as Be-Analysis shows Bierman 2016: Be-record of East GreenL: ice stable for 7My. Bierman 2023: leaves found in West Greenland, age 400ky. Cd he pls do Be-tests on West GL core to verify his past conclusions?

X (formerly Twitter)

The preprint with #AMOC tipping years 2037-2064 by team #vanWesten has now been peer-reviewed and CNN has a good explainer article on it. Also quotes @rahmstorf https://amp.cnn.com/cnn/2024/08/02/climate/atlantic-circulation-collapse-timing

The post above shows the Southern #Atlantic surface salinity measurements they based their prediction on. (I was too lazy to plot other ocean depths and latitude bands where they also found Early Warning Signals – the data is just too spotty.)

A critical system of Atlantic Ocean currents could collapse as early as the 2030s, new research suggests

It uses state-of-the-art models to estimate the shutdown could happen between 2037 and 2064, and that it’s more likely than not to collapse by 2050.

CNN

The promised plots.
I'll show data since 2003 only because only then did real measurements really kick off. Before that, measurements were so spotty with 1 in January in one year, then 3 years nothing, then 5 measurements in for example August and so on.
Data source for measurements is #NOAA https://www.ncei.noaa.gov/access/world-ocean-database-select/dbsearch.html

The other plot is from a #ReAnalysis called EN4.2 https://www.metoffice.gov.uk/hadobs/en4/download-en4-2-2.html#c14_analyses
It is based on the same NOAA data, and goes back to 1900. EN4.2 has better quality assurance than my download. And EN4.2 is able to calculate the likely values in adjacent coordinates and adjacent months.

Among other Reanalyses, EN4.2 has also been used in the newest preprint by the Dutch team around #vanWesten. It sees AMOC tip in 2065 in RCP8.5 and in 2085 in RCP4.5. But it is based on biased Reanalyses and known-to-be too stable #CMIP6: https://arxiv.org/pdf/2407.19909

Whereas the first new preprint by van Westen's team, which tips AMOC 2037-2064, uses only real measurements of the 3 dedicated monitoring arrays in the North, tropical and South #Atlantic. https://arxiv.org/pdf/2406.11738
Here, the caveat is: very short data series.

With measurements being so spotty, I only show monthly salinity 2003ff in down to 10m depth. And only from the area in the South Atlantic. Averaged on a 2 by 2 degree grid from Argentina's coast to longitude -48, and latitudes 40-48 South.

Sorry, not sorry: neither dataset shows a smoking gun. 😁
#FridaysForFuture #ChartsForFuture

World Ocean Database Select

Another team asked whether #AMOC collapse is at all possible in #IPCC #climate models bc those models are apparently known to have strong bias toward keeping a stable AMOC. (I can relate😁 )
The team ran an experiment in which they took a pre-industrial Earth without climate change,
and every model year added a little bit more freshwater to it. This was just to prove that even those unrealistically stable model types can produce a tipped and collapsed AMOC with a certain AMOUNT of freshwater. (As opposed to making AMOC tipsy by the speed of adding smaller amounts of freshwater. See above post.)

#vanWesten etal 2024 "Physics-based early warning signal shows that AMOC is on tipping course"
https://www.science.org/doi/abs/10.1126/sciadv.adk1189
The paper also describes in vivid colour the impacts a tipped AMOC has (in a pre-industrial world). Immediately. Even tho the time from tipping to collapse or OFF might be 100 years: dramatic changes all over the world start from the first decade of a tipped system.

Have a look at all the diagrams and maps in the paper and in the supplement to feed your nightmares with gory details.

In a bi-monthly rhythm, this team of 4 scientists feeds us more details on their findings.

In this preprint, they project the tipping schedule: "The collapse time is estimated between 2037-2064 (10-90% CI) with a mean of 2050 and the probability of an AMOC collapse before the year 2050 is estimated to be 59 +/- 17%." https://arxiv.org/abs/2406.11738 #Smolders 2024 "Probability Estimates of a 21st Century AMOC Collapse"

Don't confuse it with #Ditlevsen 2023 who also put that year in our calendar, but arriving at it using a different method .

I don't know what they mean with "collapse". Do they mean the moment of tipping, the period of unstoppable slowdown? Or the actual off-state, the collapsED AMOC?

Anyway. What the study also looks at are locations of Early Warning Signals, EWS. And unfortunately, the 2 regions where "we" are actively monitoring the AMOC strength are not early-warning-regions at all. Nor is the Cold Blob.
Bummer. (The installations are called RAPID and OSNAP if you want to look them up.)

Where we should have set up monitoring installations 20 years ago was near South Africa's coast in a depth of 500m, where salinity transport changes before tipping occurs 4000km further North...

I do recall reading just this in their already published paper, too. Latitude 34°S is where all the action is, according to the team in Utrecht, Netherlands.

In the next post I'll show a heatmap of salinity at 32 to 36°S in depths of 150 to 700m. Brace yourselves...