New LabPlot tutorial:
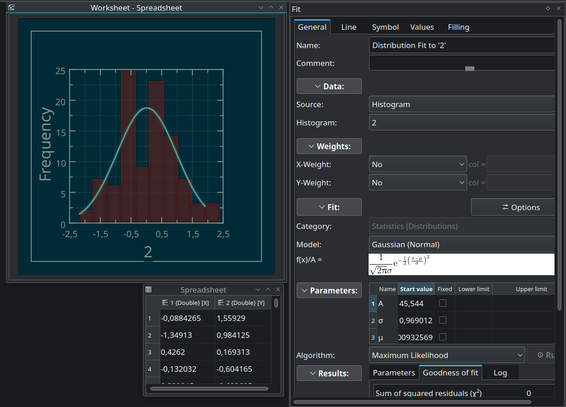
In this short video you'll learn how to fit a distribution to data.
#DistributionFitting #GaussianDistribution, #Log-normalDistribution #ProbabilityDistribution #PoissonDistribution #Binomial #Distribution #ExponentialDistribution #MaximumLikelihood #SciDAViS