Wer macht I/O-Ärger auf meinem #Linux?

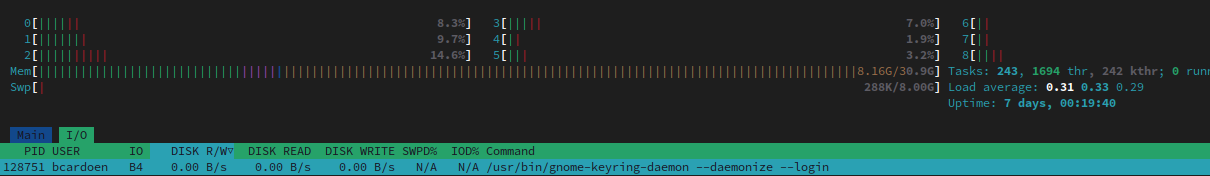
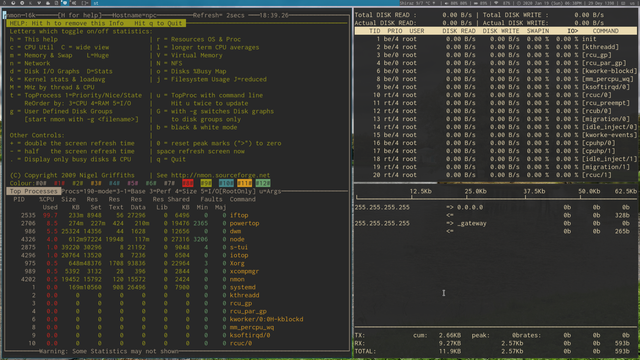
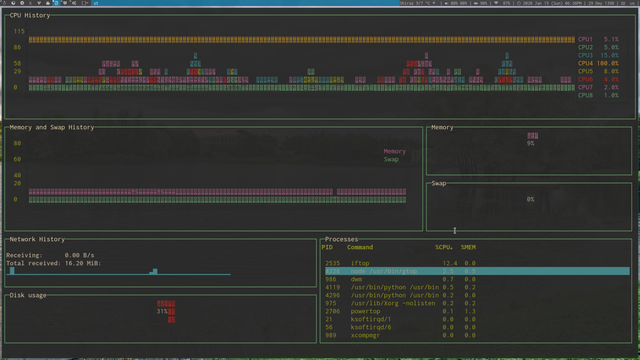
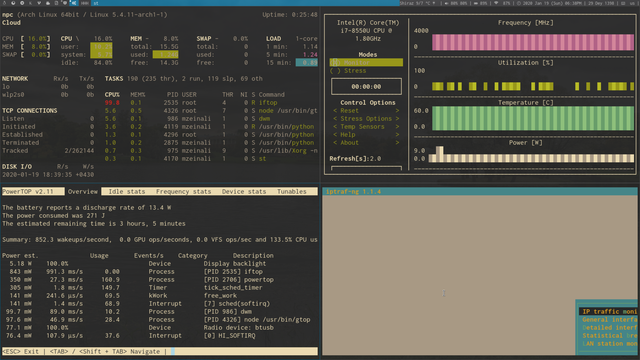
Wenn Ihr mal wieder I/O-Probleme auf Eurer Linux-Kiste habt, mein Tipp: iotop. Der zeigt Euch genau an, WER die Probleme verursacht. Das Tool iostat (sysstat Packet) zeigt nur die gesamte I/O-Systemlast an. Das reicht oft nicht. Wenn Ihr schon flächendeckend SSD ausgerollt habt, wird Euch das wahrscheinlich nicht mehr sonderlich jucken...
Meine Notizen hier: https://www.shinguz.ch/computer/linux/disk-io/

#iotop #iostat #ssd #hdd #perfomance

Linux Disk I/O

Mein Notizen zu Linux und Disk I/O

В новый #htop добавили вкладку с i/o, теперь #iotop стал ненужен. Осталось добавить функции #atop, #atopsar, мониторинг сети и будет универсальный комбайн для мониторинга системы.

@nixCraft personally I prefer #btop becaise it is not just fany but can be made to work on regular #tty terminals in 80x24.

  • I wish #iotop would work better, tho the way it's interfacing with the #linux #Kernel is naturally the reason it requires #sudo.
@roygreenhilt what would be even cooler if it can replace iotop but #iotop on #Linux is severely restricted for security reasons.

В UNIX подібних ОС є стандартна програма top яка відображає таблицю процесів, назва розшифровується як Table Of Processes. Від імені цієї програми пішли назви інших, схожих програм, але які керують не тільки процесами, а й іншими елементами.

  • htop Всім відома сучасна альтернатива стандартної програми top, але з оновленим інтерфейсом і розширеним функціоналом.

  • iotop Надає інформацію про використання вводу/виводу (I/O) дисків процесами.

  • iftop Відображає зʼєднання та використання мережевих інтерфейсів.

  • nvtop Спостереження за використання процесами ресурсів відео карт AMD, Intel і NVIDIA.

  • bpytop Моніторинг ресурсів і статистика використання процесора, памʼяті, дисків, мережі та процесів.

  • btop C++ реалізація попередньої програми (bpytop).

#top #unix #linux #tools #cmd #ncurses #htop #iotop #iftop #nvtop #bpytop #btop #systemmonitor #monitoring #засоби #інструменти #cpu #gpu #mem #disk #ram #io

htop - an interactive process viewer

Newer versions of #htop now have an IO monitoring tab, saving you from parsing #iotop in #linux
Time to suggest nicely to the cluster sysadmins to upgrade their versions 🤞 , because having IO in the same app helps a lot in narrowing down why a large compute job is stalling, especially on LustreFS
@jfbucas so they basically integrated #iotop on #htop ?
@norman Wenn das MD-Raid frisch erstellt ist, muss er es ja erst mal Syncen, was IO frisst. Möglich das dies dein Testcasr verfälscht hat? `cat /proc/mdstat` sollte dir da mehr Erkenntnisse liefern. Ansonsten mal mit #iotop ggf. Schauen ob es unerwartetes delay gibt.
#btrfs nutze ich auch sehr ausgibt, aber #raid56 nutze ich da nur sehr ungern. Wenn dann sowieso nur mit METADATA- und SYSTEM-Chunks in #raid1c4 bzw. #raid1c3.

Gibt es zu #iotop eigenltich eine Alternative die ein bisschen weniger "hässlich" ist?

#console

#iotop is an I/O monitor

iotop monitors the amount of input and output throughput each process or thread is using. Totals as well as per process percentages are also calculated for easy reference. iotop can also run in batch mode which disables interactivity and instead prints all statistics periodically.

Website 🔗️: http://guichaz.free.fr/iotop/

apt 📦️: iotop

#free #opensource #foss #fossmendations #sysadmin

Iotop's homepage

Iotop's homepage