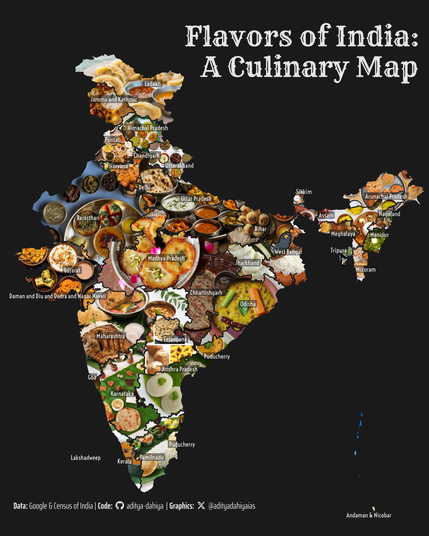
#maps #dataviz Combining powers of
#ggplot2 with {sf}, {ggrepel} and {ggpattern} to make a Culinary Map of
#India.
Data: @
[email protected] & Survey of India
Full Code 🔗
https://tinyurl.com/india-cuisinesTools:
#rstats #sf #ggpattern by
@coolbutuseless Mapping India’s Cuisines with R: {sf}, {ggpattern}, {magick} and more – visage
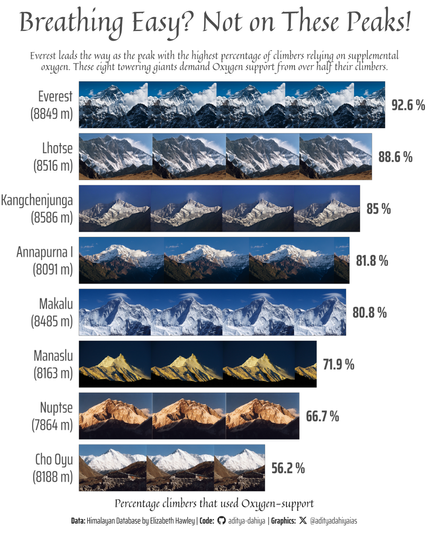
#TidyTuesday an image horizontal bar-chart of % climbers needing Oxygen on toughest Himalayan Peaks.
Data: Himalayan Database by Elizabeth Hawley (
https://himalayandatabase.com)
Full Code 🔗
https://tinyurl.com/tidy-o2-peaksTools
#rstats,
#ggplot2,
#magick,
#ggpattern by
@coolbutuseless The Himalayan Database, The Expedition Archives of Elizabeth Hawley
Himalayan Database, Expedition Archives of Elizabeth Hawley, Richard Salisbury, Elizabeth Hawley
Resources for Data Viz Accessibility | Silvia Canelón