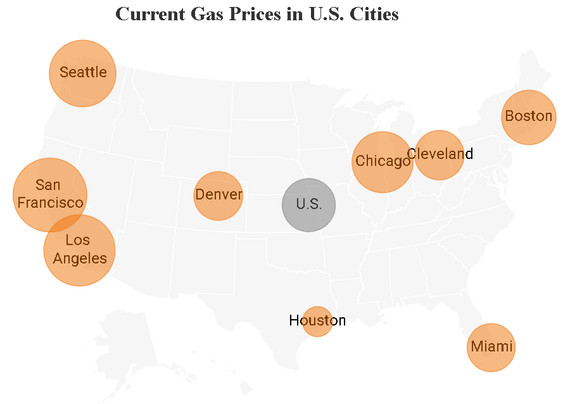
Add richer tooltips to ggiraph with kableExtra and friends: https://uncharteddata.netlify.app/posts/2022-09-30-interactive-tooltip-tables/ #dataviz #ggplot #ggiraph #UI
Add richer tooltips to ggiraph with kableExtra and friends: https://uncharteddata.netlify.app/posts/2022-09-30-interactive-tooltip-tables/ #dataviz #ggplot #ggiraph #UI
Add richer tooltips to ggiraph with kableExtra and friends: https://uncharteddata.netlify.app/posts/2022-09-30-interactive-tooltip-tables/ #dataviz #ggplot #ggiraph #UI
Anyone an idea where I can find the source code of ardata.fr/ggiraph-book/ ? The github link on the website is dead. #ggplot2 #rstats #ggiraph. Thanks!
ggiraph-book
ggiraph-book
Add richer tooltips to ggiraph with kableExtra and friends: https://uncharteddata.netlify.app/posts/2022-09-30-interactive-tooltip-tables/ #dataviz #ggplot #ggiraph #UI
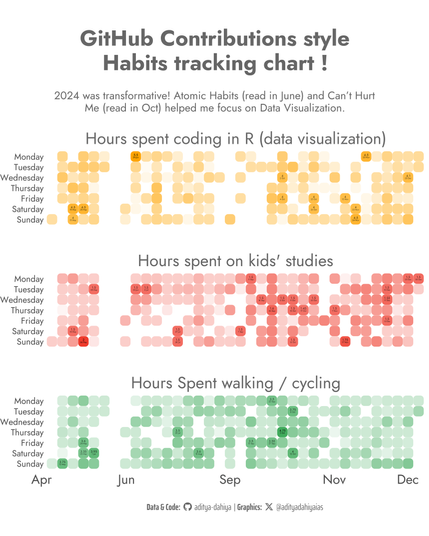
#TidyTuesday - Week 1 for 2025 - using own data to make a GitHub style contributions chart for some habits using a custom function geom_rtile() for rounded geom_tile()
Interactive Version and Full Code 🔗 https://tinyurl.com/tidy-int-habits
Tools #rstats #ggplot2 #ggiraph by @davidgohel
Interactive Version and Full Code 🔗 https://tinyurl.com/tidy-int-habits
Tools #rstats #ggplot2 #ggiraph by @davidgohel
Add richer tooltips to ggiraph with kableExtra and friends: https://uncharteddata.netlify.app/posts/2022-09-30-interactive-tooltip-tables/ #dataviz #ggplot #ggiraph #UI
Add richer tooltips to ggiraph with kableExtra and friends: https://uncharteddata.netlify.app/posts/2022-09-30-interactive-tooltip-tables/ #dataviz #ggplot #ggiraph #UI
#ggiraph by David Gohel!
An interactive plot of Decadal Population Growth in Countries. European and Latin American population growth is falling. Data: WorldBank.
Code & Interactive Viz at🔗https://tinyurl.com/viz-interact
Tools #rstats #ggplot2 #ggiraph by
@ardata @davidgohel @R4DSCommunity
Code & Interactive Viz at🔗https://tinyurl.com/viz-interact
Tools #rstats #ggplot2 #ggiraph by
@ardata @davidgohel @R4DSCommunity