Second time #CDC has reported estimates for more than two regions at a time since October.
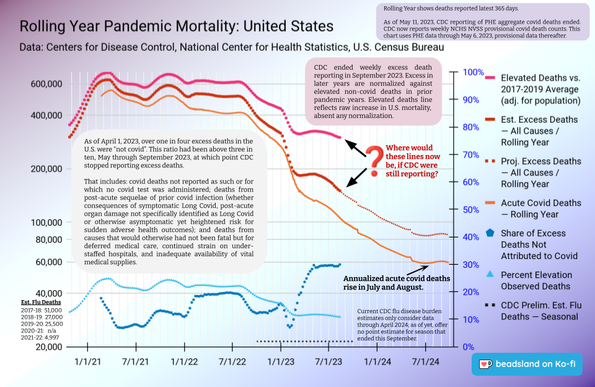
To be clear, national data used for chart above are modeled on regional data collection.
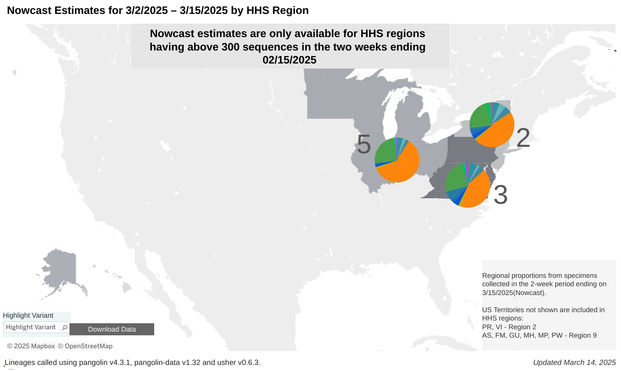
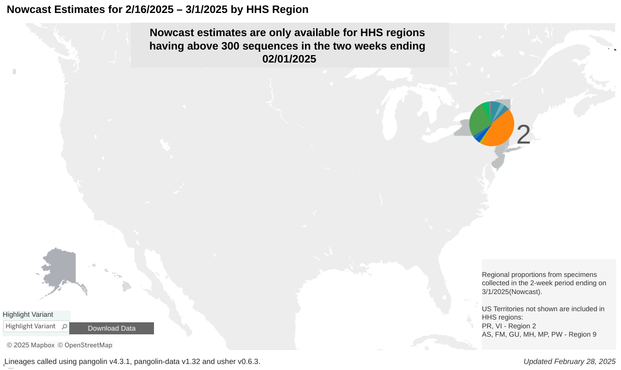
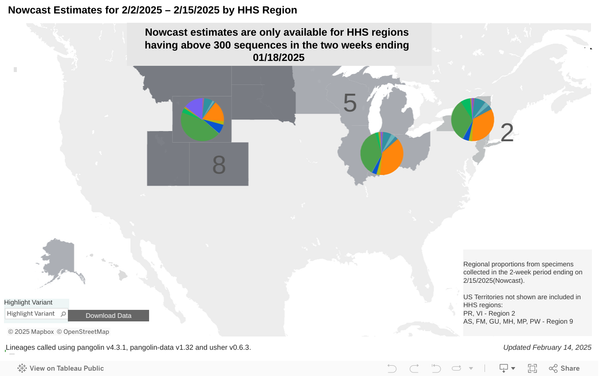
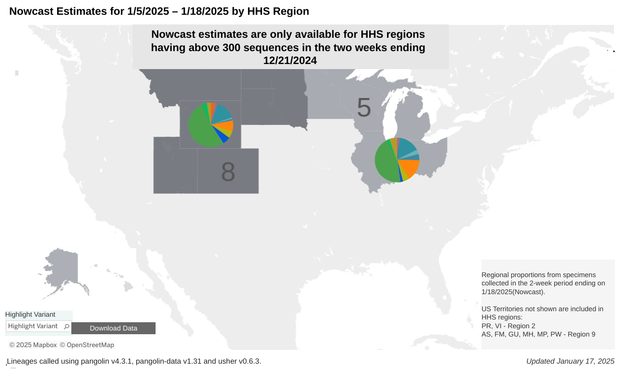
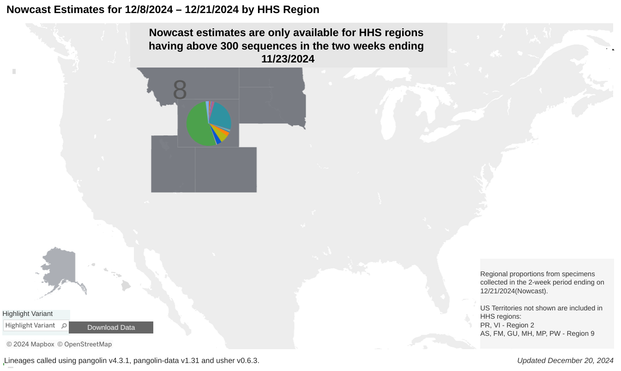
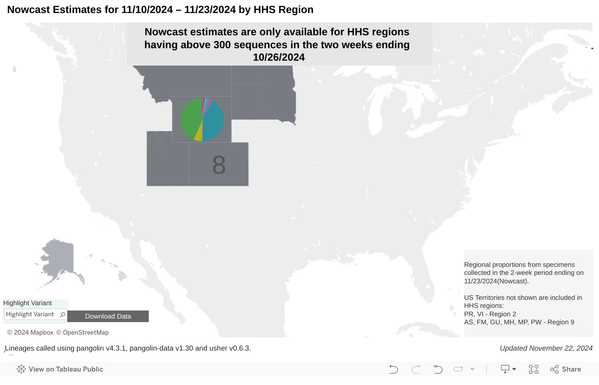
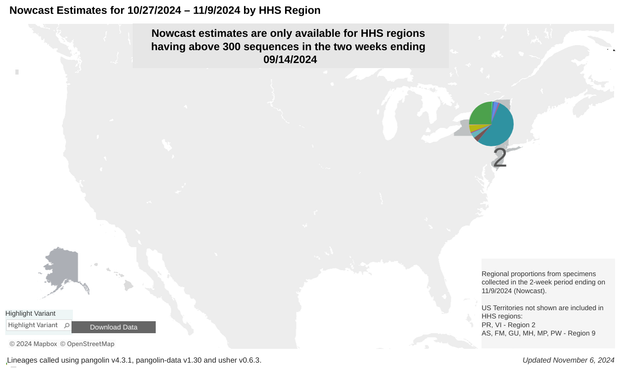
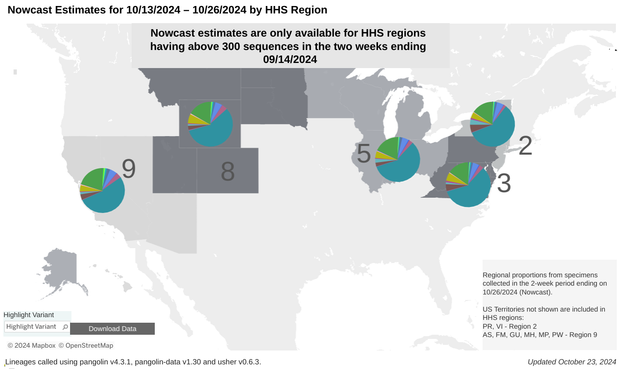
LP.8.1 now estimated at majority in Great Lakes, nearing majority in NY/NJ and Mid-Atlantic.
XEC (incl. XEC.4) still around a quarter share in all three regions.
[For color key, see: https://covid.cdc.gov/covid-data-tracker/#variant-proportions]
❖ #ThisIsOurPolio #Covid #Covid19 #SARS2 #variants #CovidIsNotOver #CovidIsAirborne #WearAMask #BetterMasks