What’s in #Trump and #Senate #Republicans#tax and immigration bill?
The Senate is on the verge of advancing Trump’s priorities in his major budget legislation. Here’s how it could change the federal government and the U.S. economy.
New tax breaks. Massive spending on border security. Cuts to social safety net. Pullbacks on investments to fight climate change. New limits on student loans.
https://www.washingtonpost.com/business/2025/06/28/republican-senate-trump-tax-immigration-plan/
https://archive.ph/roZRJ

See it in #BarCharts
Here’s what’s in the big Trump tax and immigration bill that the Senate passed

The Senate advanced Trump’s priorities, which Republicans have been calling the One Big Beautiful Bill. Here’s how it could change the federal government and the U.S. economy.

The Washington Post
🎩🔍 Ah, yes, a riveting tale of a 200-year-old "bad boy" who single-handedly disrupted the world with... bar charts? 🤔 Because nothing screams rebel like a horizontal axis. Meanwhile, modern data analysts are left wondering if they too can achieve legendary status by inventing the pie chart. 🍰
https://blog.engora.com/2023/05/the-bad-boy-of-bar-charts-william.html #badboy #dataanalysis #barcharts #piecharts #HackerNews #HackerNews #ngated
The bad boy of bar charts: William Playfair

The wild life of William Playfair, the inventor of the bar chart and pie chart

Hongkiat: 7 Best Code-Free Tools to Create Bar Chart Race. “Whether you’re presenting in class, pitching to your boss, or showing off trends at a corporate event, a Bar Chart Race brings numbers to life in a dynamic and fun way. It grabs attention and helps viewers see how stats change over time. If you’re looking to create a Bar Chart Race (with or without coding experience), check out […]

https://rbfirehose.com/2025/02/04/hongkiat-7-best-code-free-tools-to-create-bar-chart-race/

Hongkiat: 7 Best Code-Free Tools to Create Bar Chart Race | ResearchBuzz: Firehose

ResearchBuzz: Firehose | Individual posts from ResearchBuzz

@Daniel_Hoffmann

Instead of citing the Nature " #barcharts are misinterpreted" pseudo-news report, I recommend going back to the original preprint, which makes makes a positive case for what one should do to best communicate data. #visualization

https://www.biorxiv.org/content/10.1101/2024.09.20.609464v2.full

Given their wide use and proneness to misinterpretation, #barcharts are probably the worst data #visualisation https://www.nature.com/articles/d41586-024-03996-w
Bad bar charts are pervasive across biology

Scientific ‘shorthand’ could be introducing data distortions into published papers.

We forgot to do a Thursday progress check.

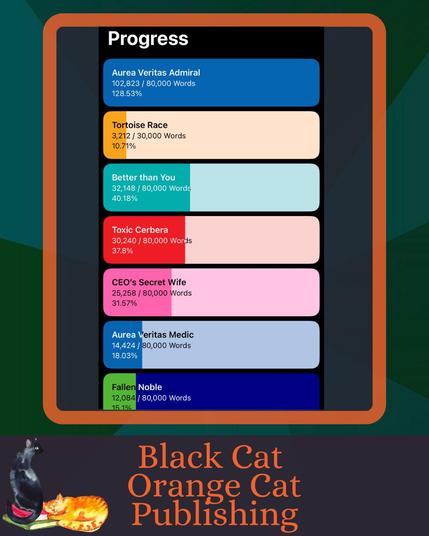
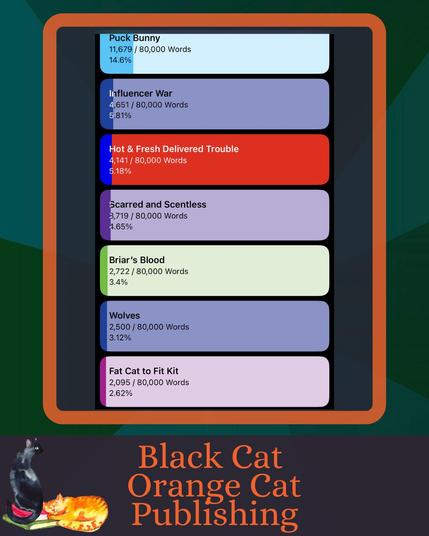
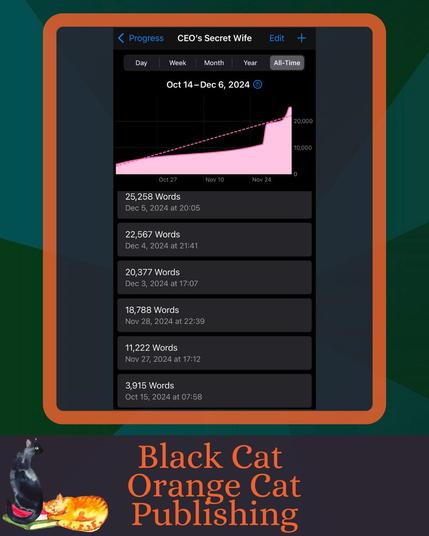
Since SC Blossom has been working the most, here’s her progress for her CEO romance.

Then the progress of all of the projects currently being worked on.

#books #progress #workinprogress #wip #blackcatorangecatpublishing #barcharts

This article aims to provide an overview of bar charts and underscore their significance as an analytical tool in Forex trading. We will delve into their structure, key components, and how to effectively interpret the information they convey. Furthermore, we will explore specific strategies and best practices for utilising bar charts to enhance trading decisions and maximise opportunities.
#forextrading #forexeducation #barcharts
https://www.geekyforex.com/overview-of-bar-charts-for-forex-trading-analysis
Overview Of Bar Charts For Forex Trading: A Complete Guide

Want to improve your Forex trading? Our overview of bar charts gives you the information needed to make informed trading decisions.

Discover two methods for tagging bar charts in Adobe Acrobat Pro DC. Make your data accessible and easy to understand. #AdobeAcrobatProDC #BarCharts #Accessibility #Tagging #AssistiveTechnology

https://theaccessibilityguy.com/how-to-tag-bar-charts-in-adobe-acrobat-pro-dc-effectively/

How to Tag Bar Charts in Adobe Acrobat Pro DC Effectively - The Accessibility Guy

Discover two methods for tagging bar charts in Adobe Acrobat Pro DC. Make your data accessible and easy to understand.

The Accessibility Guy

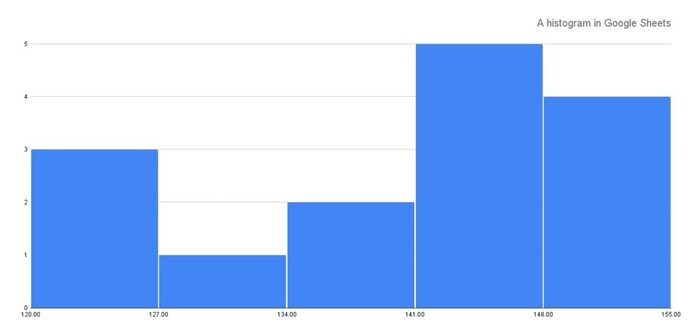
📊 Lost in a sea of numbers? Let's learn histograms with Google Sheets! 🚀 Turn those boring digits into snazzy visuals and make the numbers dance for you 🕺💃 #Histogram #BarCharts #Charts #GoogleSheets #HistogramCharts #SheetsTips

https://how2tweaks.com/how-to-make-a-histogram-in-google-sheets/

How to Make a Histogram in Google Sheets 2023

Have you ever found yourself drowning in a sea of numbers, trying to make sense of data? Visual representation can be a lifesaver, and histograms are one of

How2Tweaks

Drawing Barcharts is so Simple in Python!

Drawing barcharts in Python is so simple. All you need is the pandas library, a DataFrame and the plot() function!

#python #pythonlearning #pandas #barcharts #datascience #dataviz