Solana's price is lookin' hot 🔥 above the 50-day EMA, but can it conquer the $180 mountain and the 200-day EMA? 🤔 Our deep dive into the charts reveals key levels and some surprising bullish signs https://www.patreon.com/posts/riding-solana-of-127664256?utm_medium=clipboard_copy&utm_source=copyLink&utm_campaign=postshare_creator&utm_content=join_link #Solana #SOL #Crypto #Trading #TechnicalAnalysis
Sustained strength above 55,200 with high momentum would nullify the Evening Star setup and revive bullish bias toward 59,600 levels.
📉 Bearish Scenario:
If the bearish Evening Star pattern plays out completely, a continued decline toward 52,500, followed by 50,000–49,500, looks probable.
A sustained breakdown below 49,500 would confirm a deeper correction, targeting 47,000–46,800.
Failure to hold the 6,400–6,300 support zone would indicate weakness and could drag the index lower toward the 6,000–5,800 major support zone. Sustained trading below 5,800 would extend the downtrend further.
#Trading #Investing #Stocks #TechnicalAnalysis
#Trading #Investing #Stocks #TechnicalAnalysis
If the index fails to hold above 16,000 and sustains below 15,800 on closing basis, the Inverted Head and Shoulders setup would fail, leading to extended downside toward 15,200–15,000 levels. This would temporarily negate the bullish bias.
If Nifty fails to defend the 23,400 support zone and sustains below it, a deeper correction toward 23,000 or even 22,500 could materialize. This would neutralize the breakout attempt and bring the index back inside the broader range, calling for cautious positioning.
The Consolidation Zone and the Uncertainty http://dlvr.it/TKPFyd #Trading #Forex #MarketAnalysis #TechnicalAnalysis #ShortPosition

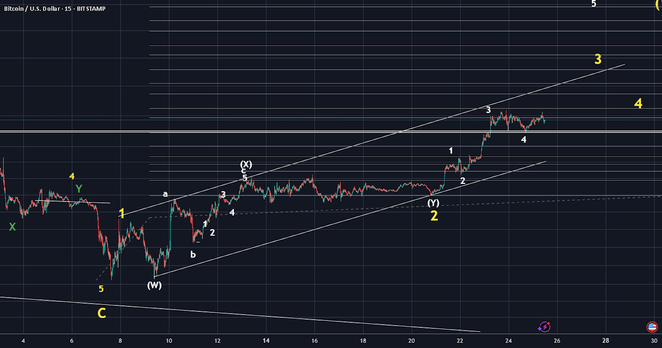
double three (running) http://dlvr.it/TKMM0N #Bitcoin #CryptoTrading #TechnicalAnalysis #ElliottWave #Investing

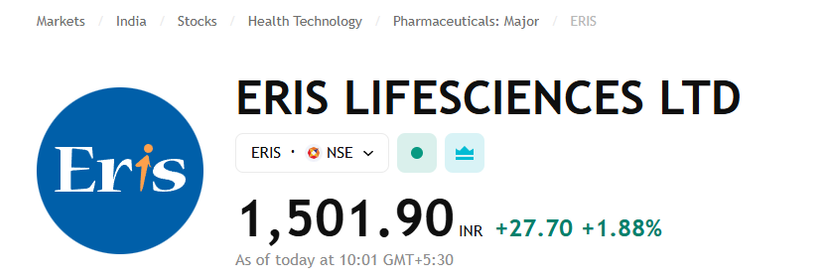
📊 Cash Breakout Alert – ERIS Lifesciences Ltd
💸 Price: ₹1501
Check the setup and review the price action – volume, structure, and momentum look solid.
📥 For detailed chart analysis: ✅ Follow🔁 Retweet 💬 Comment
#TechnicalAnalysis #BreakoutStock #ERIS #StockMarket #TradingView #CashStock
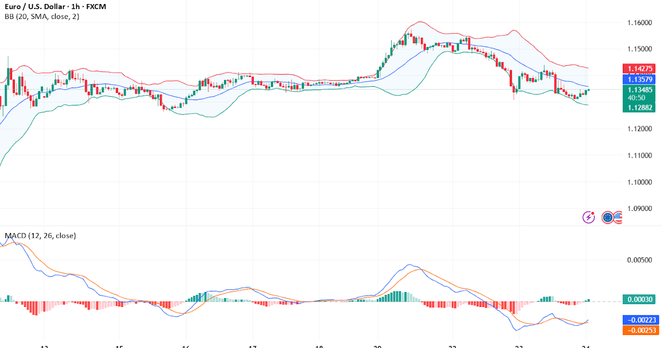
EURUSD(20250424) Today's Analysis http://dlvr.it/TKL4QP #EURUSD #ForexTrading #MarketAnalysis #TechnicalAnalysis #TradingStrategy