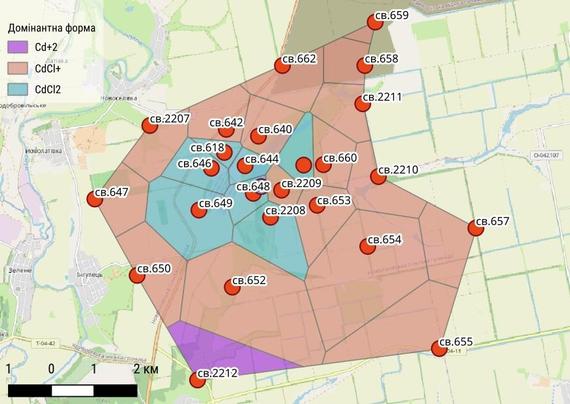
🎨 When visualization becomes part of thinking
In geochemical modeling, diagrams are not decoration — they’re analytical tools.
Every chart and map I create goes through many iterations: filtering, reshaping, and transforming multi-dimensional geochemical data until patterns start to reveal themselves.
Good visualization doesn’t just show results — it creates insight.
It helps trace hidden geochemical transitions, test hypotheses, and understand how contamination evolves through space and chemistry.
🧩 For me, plotting and modeling are inseparable parts of one process — the science of seeing.
📘 All supporting data and modeling results are included in the draft monograph:
🔗 https://zenodo.org/records/16741148
🧪 Modeling & visualization: PHREEQC + R + QGIS
#Geochemistry #GeochemicalModeling #DataVisualization #ScientificGraphics #EnvironmentalScience #GroundwaterQuality #PHREEQC #RStats #QGIS #GeoscienceCommunication #IndependentResearch #SvystunovaGully